Monitoring
Percona Everest provides monitoring capabilities with PMM to maintain a reliable and secure database infrastructure.
Here are some key benefits you’ll get with monitoring of Percona Everest:
- Database availability and uptime tracking
- Insights into your database performance
- Proactive issue detection and addressing opportunities
- Continuous monitoring
Prerequisites
To use monitoring in Percona Everest, you should have a PMM instance up and running.
For information on installing PMM, see the documentation.
Add monitoring from the UI
Important
When setting up DB cluster monitoring, using endpoints added through the user interface will result in a limited selection of metrics being sent to PMM. To receive the full range of metrics (including k8s data points), configure monitoring endpoints using the Everest CLI everestctl monitoring enable command.
To add monitoring in Percona Everest from the UI:
-
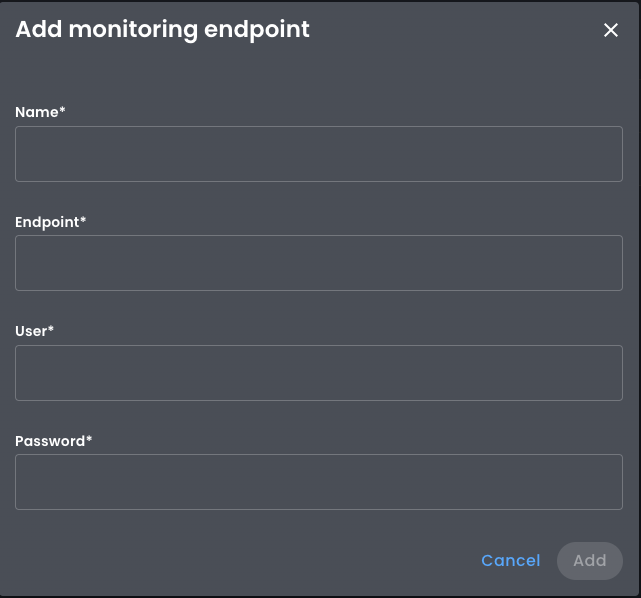
From the Percona Everest Homepage, navigate to Settings > Monitoring endpoints. The Add monitoring endpoint dialogue box opens.
-
On the Add monitoring endpoint screen, enter a PMM instance name. In the User and Password field, enter the credentials received upon installing PMM. In the Endpoint field, enter the PMM URL.
Edit monitoring from the UI
To edit a monitoring endpoint from Percona Everest UI:
-
From the Percona Everest Homepage, navigate to Settings > Monitoring endpoints.
-
Click on the ellipsis (three dots) next to the endpoint you need to edit. The Edit monitoring endpoint dialogue box opens.
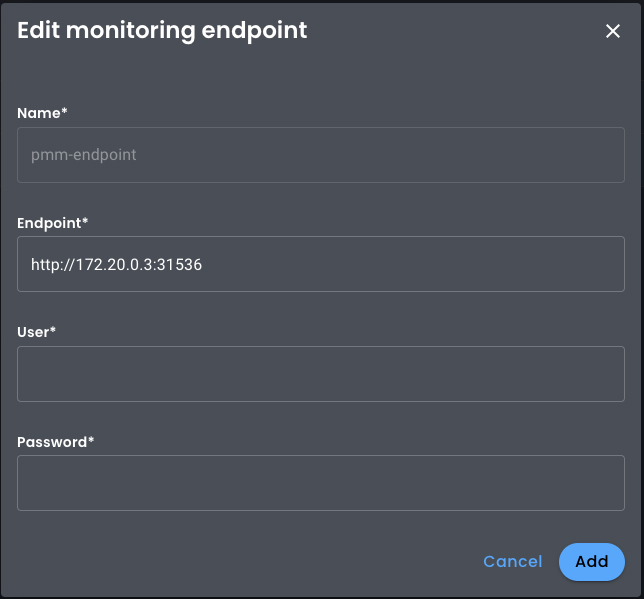
-
Click Add.
Add monitoring from the CLI
warning
The everestctl monitoring enable command has some limitations. It is recommended that you review these limitations carefully. These limitations will be addressed and resolved in the subsequent releases.
To add monitoring in Percona Everest from the CLI:
-
You can add monitoring in Percona Everest using the following command:
everestctl monitoring enable -
Enter the following information on the CLI:
- Everest URL Endpoint - URL of the Percona Everest instance
- Everest Token - The authorization token received while installing Percona Everest
- PMM URL Endpoint - URL of the PMM instance
- Username and Password - Credentials for the PMM instance
- Name for the new monitoring instance - Any name you want to give to the monitoring instance
-
Go to Percona Everest UI and navigate to Settings > Monitoring endpoints. This monitoring instance will be dispalyed on this page.
Limitations
-
If using a PMM server instance with a self-signed certificate, you cannot use HTTPS in the PMM URL endpoint.
-
The
everestctl monitoring enablecommand has the following limitations:When you run
everestctl monitoring enablecommand, the everest pod will restart. If you are using port-forwarding to access Everest (kubectl port-forward svc/everest 8080:8080 -n percona-everest), then the port-forwarding will stop, and the command will fail.Solution
Before running the
everestctl monitoring enablecommand, stop the port-forwarding command that you ran while installing Percona Everest and run the following command instead.kubectl port-forward svc/everest 8080:8080 -n percona-everest; kubectl port-forward svc/everest 8080:8080 -n percona-everestThis ensures that a new port-forwarding tunnel will be created if the connection is lost due to a Percona Everest restart.
The
everestctl monitoring enablecommand is not very intuitive.When using this command, you can have the following scenarios:
Scenario 1
If you haven’t configured monitoring points in the UI yet, then leave the Registered instance name field empty.
everestctl monitoring enableOutput
? Everest URL endpoint http://127.0.0.1:8080
? Everest Token ********************************************************************************************************************************
? Registered instance name
? PMM URL Endpoint http://127.0.0.1
? Username admin
? Password *****
? Name for the new monitoring instance - dev-pmm
If you are running the command in headless mode (
--skip-wizardflag), then run the following command:everestctl monitoring enable --everest-url='http://127.0.0.1:8080' --everest-token=<token> --new-instance-name='dev-pmm' --pmm.endpoint='http://127.0.0.1' --pmm.username='admin' --pmm.password=<password> --skip-wizardScenario 2
If you already have a monitoring endpoint configured in the UI and want to use it to receive the complete set of metrics (including k8s metrics), then enter a value in the Registered instance name field.
Output
everestctl monitoring enable
? Everest URL endpoint http://127.0.0.1:8080
? Everest Token ********************************************************************************************************************************
? Registered instance name dev-pmm
If you are running the command in headless mode (
--skip-wizardflag), then run the following command:everestctl monitoring enable --everest-url='http://127.0.0.1:8080' --everest-token=<token> --instance-name='dev-pmm' --skip-wizard
-
Get expert help
If you need assistance, visit the community forum for comprehensive and free database knowledge, or contact our Percona Database Experts for professional support and services.
