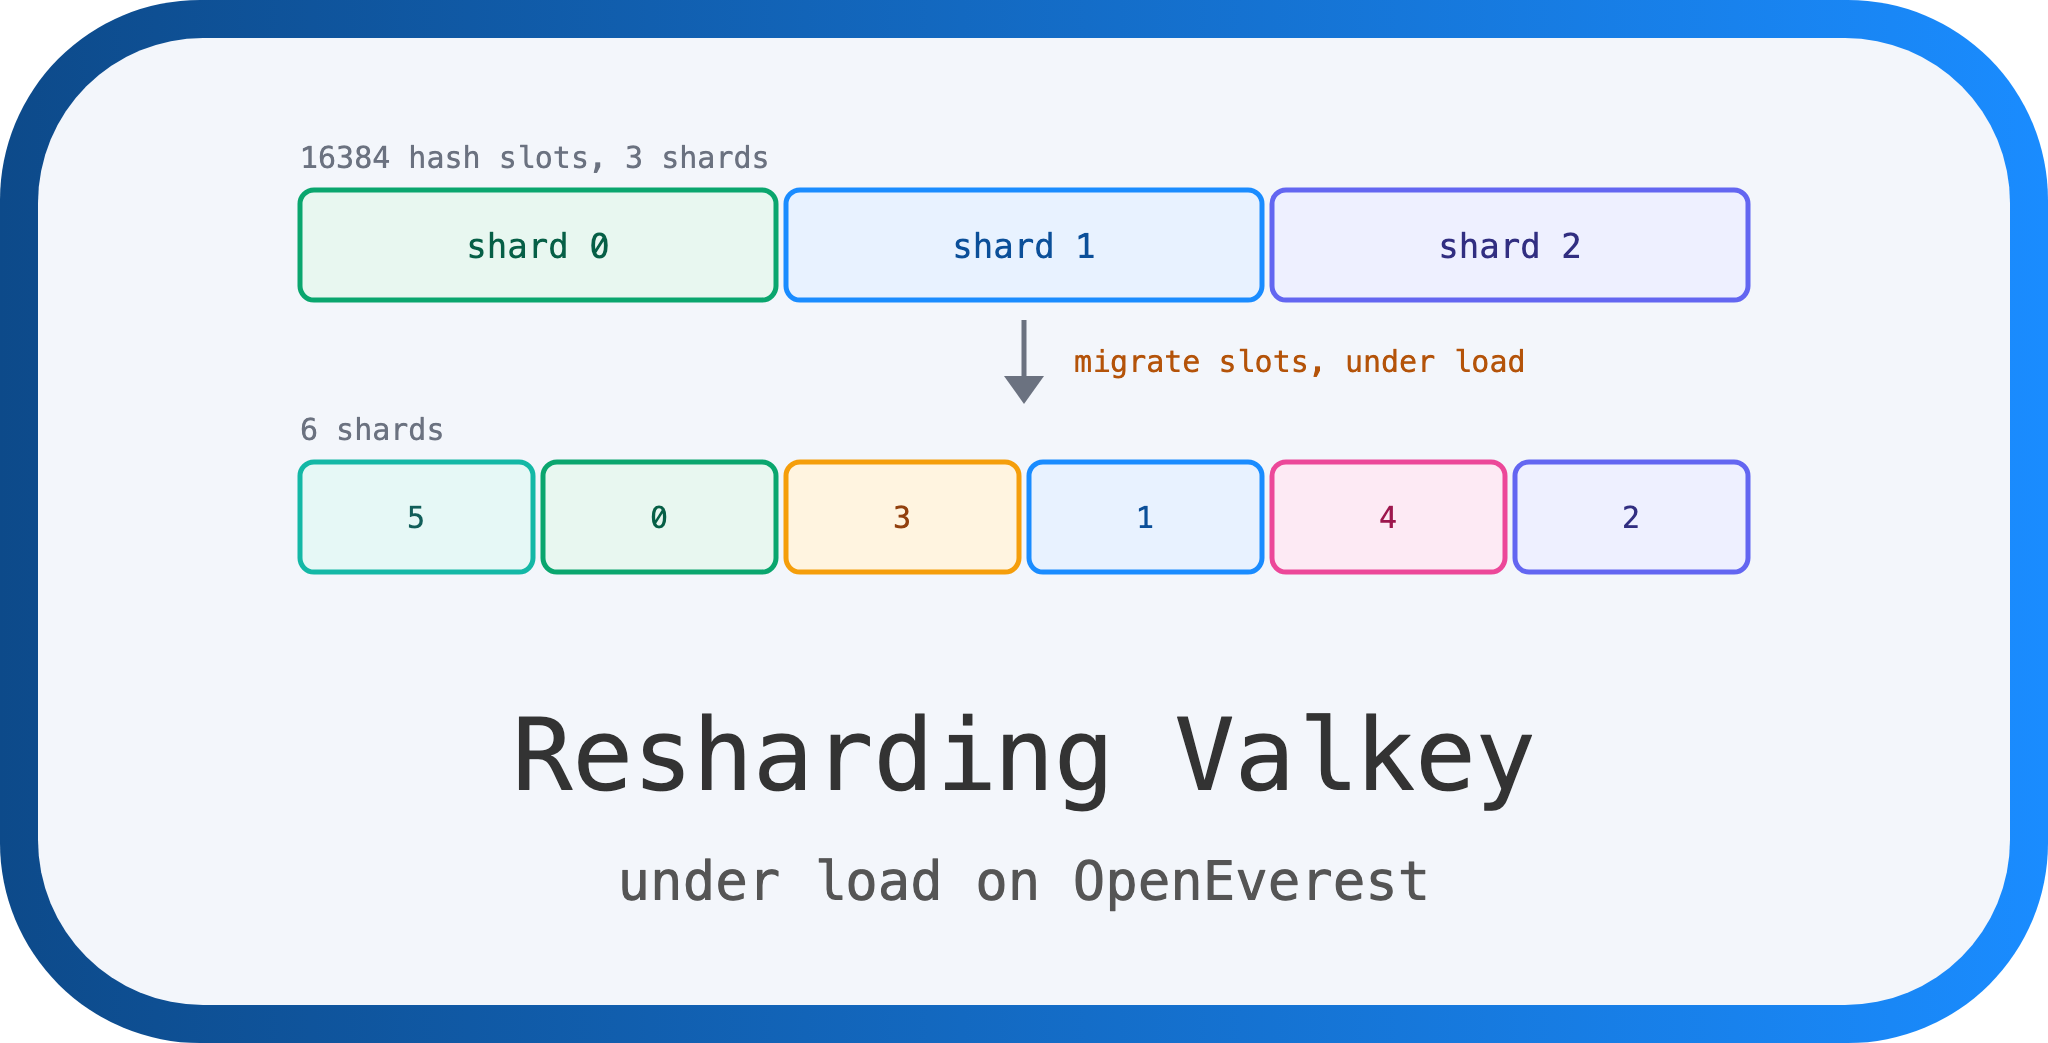
Resharding Valkey Under Load on OpenEverest
 Sergey Pronin
Scaling a sharded database is easy to promise and hard to do. You can add a shard in one line of YAML. The data still has to move, and clients still have to find it while it moves.
provider-valkey runs Valkey Cluster on OpenEverest through the Valkey operator. The operator can change the number of shards on a live cluster. I wanted to know what this looks like from the client side: does throughput actually grow, do clients get errors, and can you lose data. I also wanted to see how it behaves when things go wrong in the middle, because they do.
So I built a cluster that was already maxed out, and started changing it.
The setup
- Kubernetes 1.36 cluster
- 4 dedicated nodes for Valkey (16 vCPU, 32 GB each) and 1 node for monitoring and test clients
- OpenEverest v2.0.0-dev.4
provider-valkey0.1.8 with valkey-operator 0.7.1- Valkey 9.0.6, cluster topology, 3 shards with 1 replica each, TLS on
- kube-prometheus-stack and the OpenEverest metrics plugin for dashboards
This is where everything ran once the cluster had 6 shards. Each shard is a primary and a replica, and the operator never puts two pods of the same shard on one node. The dashed shards are the ones the scale-out added.
Every client talks to every shard, so each memtier pod sends traffic to all four nodes, not just its own. Which pod of a shard is the primary changed during the tests, because every failover swaps the roles.
This is the Instance. It is what you get from the UI, plus a node selector and two config lines:
apiVersion: core.openeverest.io/v1alpha1
kind: Instance
metadata:
  name: vk-shards
  namespace: valkey-blog
spec:
  providerRef:
    name: valkey
  version: "9.0"
  topology:
    type: cluster
    parameters:
      numShards: 3
  components:
    engine:
      type: valkey
      replicas: 1
      resources:
        limits:
          cpu: "2"
          memory: 4Gi
      storage:
        size: 10Gi
        storageClass: linode-block-storage
      parameters:
        config:
          maxmemory: 3gb
          maxmemory-policy: noeviction
    monitoring:
      type: exporter
To scale, I changed one number:
kubectl patch instance vk-shards -n valkey-blog --type merge \
  -p '{"spec":{"topology":{"parameters":{"numShards":6}}}}'
You can’t change the number of shards in the UI yet. It is a known gap, more on it below.
How I tested
I needed two clients: one to put real pressure on the cluster, and one to tell me exactly which writes failed and whether anything got lost.
Load. Four memtier_benchmark pods in cluster mode, one per Valkey node. Each runs 3 threads with 25 connections, 1 SET for every 4 GETs, 1 KB values over 2 million keys. Before the tests I preloaded all 2 million keys. memtier exposes Prometheus metrics, so throughput, errors and latency end up on the same dashboards as Valkey.
Probe. A small Python script with redis-py’s cluster client. Eight processes write sequential keys like probe:{3:5124}:5124017. The {3:5124} part is a hash tag, so every 1,000 consecutive keys land in the same hash slot. Every write is either acknowledged or recorded as failed. At the end I read back every acknowledged key. If an acknowledged key is missing, the cluster lost it. The hash tag also tells me the slot, and the slot tells me which shard lost it.
Monitoring. A loop that recorded the ValkeyCluster status every few seconds, and Prometheus scraping every 5 seconds.
The important detail: the cluster was already saturated before every test. With 3 shards, each primary’s main thread was pinned at one CPU core. Valkey runs commands on a single thread, so one core per primary is the ceiling. The cluster did about 39,000 ops/sec with p99 latency around 48 ms. If adding shards works, throughput should go up. If it doesn’t, nothing else matters.
That is the worst case, not a normal day. So at the end I repeated both scaling directions at about 45% of capacity, which is closer to how a production cluster should run.
Scaling out: 3 to 6 shards
I changed numShards from 3 to 6 and watched. The whole thing took 126 seconds, and throughput almost doubled.
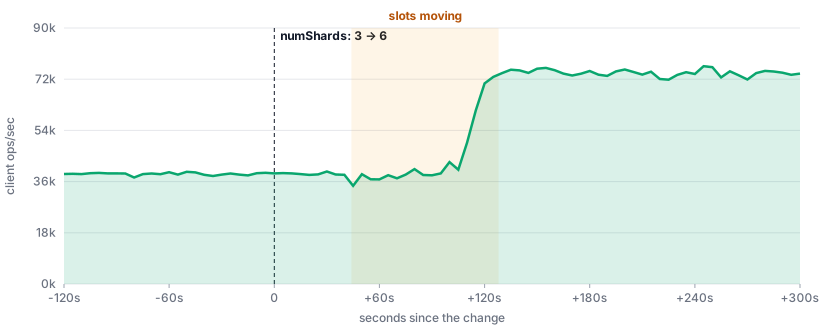
memtier ops/sec. Flat at ~39k while the new pods start, then ~75k once the slots have moved. p99 latency stayed at ~48 ms the whole time: the cluster is still saturated, there are just twice as many cores doing the work.
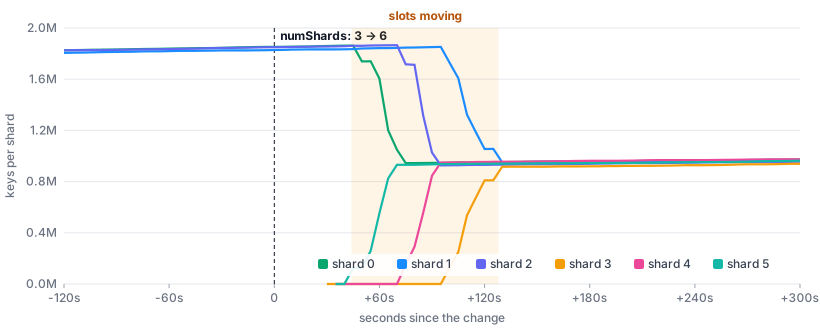
Each old shard gives half of its keys to one new shard, one pair at a time: shard 0 to shard 5, then 2 to 4, then 1 to 3. About 900k keys per pair, moved in roughly 25 seconds while the cluster served full traffic.
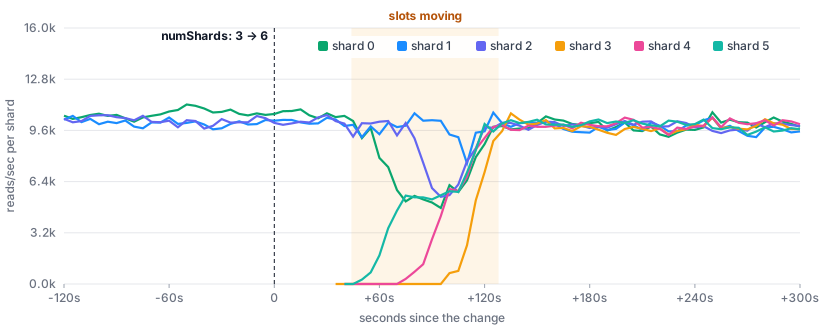
Reads per shard, from the Valkey exporter. About 10k reads/sec per shard before and after. Each shard was already doing all it could, so the only way to get more is more shards.
What happens inside
Valkey Cluster splits the key space into 16,384 hash slots. Every key belongs to one slot, and every slot belongs to one shard. Scaling out means creating new shards and moving slots to them, together with the keys.
Valkey 9.0 brought a big change here: atomic slot migration. Before 9.0, moving a slot meant moving its keys one by one with MIGRATE. While a slot was half-moved, clients got ASK redirects and multi-key commands could fail. Now the operator sends one CLUSTER MIGRATESLOTS command to the source. The source sends a snapshot of the slots to the target, streams the changes that happen in the meantime, pauses writes for a moment and hands over ownership in one step. It works a lot like replication. Clients don’t see the slot until it has moved, and then get one MOVED for it. The operator moves up to 400 slots per batch, one batch per reconcile.
Click through the timeline:
Clients: ~39k ops/sec, every primary at 1 core
I set numShards: 6. OpenEverest passes it to the ValkeyCluster, and the operator creates ValkeyNode resources for shards 3, 4 and 5, a primary and a replica each.
Clients: ~39k ops/sec, nothing changed yet
Six new pods wait for their volumes. For about 10 seconds the cluster status says Degraded: PodUnschedulable ... unbound immediate PersistentVolumeClaims. It looks scary, but it's only the cloud volumes being created. Then the pods start and join the cluster without slots.
Clients: ~37k ops/sec, memtier gets 5,060 × CLUSTERDOWN in 10 seconds. The probe: 0 errors
The operator starts moving the lower half of shard 0's slots to shard 5, 400 slots at a time. For about 10 seconds, the new primary of shard 5 answers some commands with -CLUSTERDOWN The cluster is down. Only the first new shard did this, and it happened in every scale-out I did. The probe didn't notice because redis-py retries ClusterDownError on its own.
Clients: ~38k ops/sec, no errors. Still flat
Shard 5 is done. Before the next move, the operator waits until the new shard's replica has synced (Waiting for replica sync). That's the right call: a primary with fresh data and no synced replica is one crash away from losing it. Then shard 2 hands half of its slots to shard 4.
Why is throughput still flat? Every memtier connection sends a request and waits for the answer, and keys are spread evenly. Shards 1 and 2 still own a third of all keys each and are still at 100% CPU. The cluster is as fast as its busiest shard.
Clients: ~40k ops/sec, then a jump to 70k in 20 seconds
The last pair: shard 1 to shard 3. Only when this move is done, no shard owns more than a sixth of the slots, and throughput jumps.
Clients: ~75k ops/sec, same p99, six primaries at 1 core each
The cluster is Ready, 126 seconds after the change. 2,730 slots per shard, about 950k keys each. During the whole run OpenEverest showed the instance as Provisioning, even though it served traffic all the time.
To me this is the best part of the whole exercise. One number in the spec, two minutes, and twice the throughput, with zero lost writes and no client-visible errors except the CLUSTERDOWN burst. I don’t have an explanation for that burst yet, but a client that retries doesn’t see it.
Scaling in
Scaling in is the same in reverse: move slots off the shards you remove, then delete them. I did it twice. 6 → 3 with lighter load took 313 seconds without a single error.
The second time I made it harder: 6 → 4 shards and 1 → 2 replicas per shard in the same change, at full load. It took 776 seconds, and again 0 failed writes. The operator first added the new replicas, then drained shards 4 and 5, then rebalanced. But look at where the keys went:
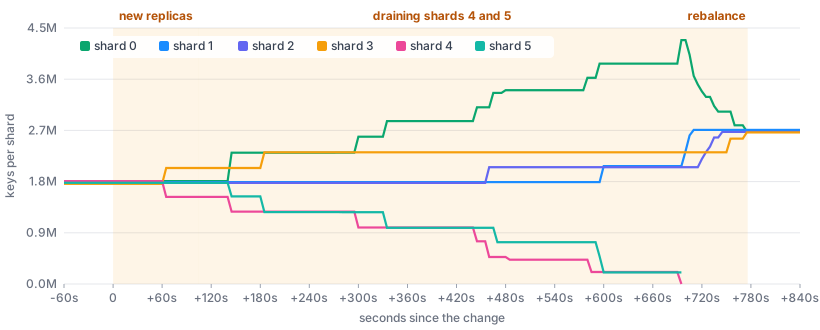
Most of the drained slots went to shard 0. It peaked at 4.3 million keys, 1.6 times its final size, and only then the operator spread them out. The 6 → 3 run looked the same: shard 0 peaked at 1.7 times its final size. That’s how the drain is written right now. It picks “the first valid destination” and leaves the rest to the rebalance at the end. The comment calls this intentionally simple.
It has two effects. A lot of data moves twice. And shard 0 becomes the hot shard: it owns a big share of slots, but it still has one core. Remember, the cluster is as fast as its busiest shard. Throughput went down from 73k to about 33k ops/sec during the drain and came back to 50k at the end (4 shards × 1 core). The scary part is memory. My shards used about 0.8 GB of 3 GB, so there was plenty of room. If your shards are 60% full and you scale in, the receiving shard can hit maxmemory, and with noeviction that means failed writes. With an eviction policy it is worse: Valkey silently drops keys.
Is 776 seconds a lot? Yes. The Valkey team measured a 4 → 3 scale-in of a 40 GB cluster under heavy load in 27 seconds. That’s roughly 370 MB/s. My drain moved about 1.6 GB, counting the second move off shard 0, in about 670 seconds. That’s 2 to 3 MB/s. It isn’t a fair fight: my primaries had no CPU left, and migration has to share that one thread with clients. The operator also adds pauses: 400 slots per batch, one batch per reconcile, and a replica sync check in between. But a gap this big means most of the time is spent outside Valkey.
And at a normal load?
Nobody should run a production cluster at 100% CPU. So I lowered memtier’s request rate to about 45% of capacity. p99 latency dropped to 7 ms. Then I scaled out 4 → 6 and back to 4.
One detail if you try this: in cluster mode, memtier’s --rate-limiting applies to every connection to every shard. The offered load grows and shrinks with the number of shards, so for these runs I compare latency, not throughput.
| Saturated | ~45% load | |
|---|---|---|
| Scale out | 3 → 6: 126 s | 4 → 6: 118 s |
| Scale in | 6 → 4, plus replicas 1 → 2: 776 s | 6 → 4: 129 s |
| Failed probe writes | 0 and 0 | 3 (CLUSTERDOWN) and 0 |
| p99 before → worst during | 48 → 63 ms, 45 → 50 ms | 8 → 43 ms, 6 → 36 ms |
| Shard 0 peak during scale-in | 1.6× final size | 1.5× final size |
Scale-out takes about two minutes either way. Most of that is creating pods and volumes, and the operator waiting between moves. Scale-in is six times faster with CPU to spare, even after you subtract the replica change from the saturated run. Clients see the change as a latency bump into the tens of milliseconds for a minute or two. They don’t see errors.
The hot shard didn’t go away: shard 0 still peaked at 1.5 times its final size. That comes from the drain logic, not from the load.
Draining a node
Kubernetes upgrades and node maintenance mean kubectl drain. I drained a node with two primaries and one replica on it:
kubectl drain lke665663-986688-kd8pd --ignore-daemonsets --delete-emptydir-data
The operator creates a PodDisruptionBudget with maxUnavailable: 1, so the drain evicts one Valkey pod at a time and retries the rest with “Cannot evict pod as it would violate the pod’s disruption budget”. Each evicted primary handed its role to its replica on shutdown. Each pod then started on another node, after its block volume detached and attached there (about 30 to 45 seconds per pod).
The drain took 114 seconds. The probe recorded 0 failed writes, with the slowest write at 1.25 seconds. memtier dipped to 48k ops/sec for a moment. That’s what a drain should look like.
Killing primaries
Planned operations went well. Now the unplanned part. I deleted primary pods in two ways:
- Graceful:
kubectl delete pod. The provider setsshutdown-on-sigterm failover, so onSIGTERMthe primary hands its slots to its replica before it exits. - Force:
kubectl delete pod --grace-period=0 --force. The process is killed without warning, like an OOM kill or a crash.
Every row is one second, from the probe’s point of view:

Graceful delete works, mostly. In 4 runs out of 5 the replica took over in about 0.7 seconds. The probe lost 0 to 2 writes, and memtier dipped to ~62k for a second. In one run the handoff didn’t happen. The replica stayed a replica, the pod restarted, and the old primary got its slots back. That was 31 seconds of failed writes for one shard. I didn’t capture the primary’s log for that run, so I don’t know why yet.
Force delete is a different story. I expected a failover. There wasn’t one, and the reason is timing:
- The pod is killed, and Kubernetes starts a new one right away. Valkey is up again in about 2 seconds.
- Valkey declares a node failed only after
cluster-node-timeout, which is 15 seconds. The restarted node is back long before that. Nobody fails over. - The restarted node still has its
nodes.conf, so it rejoins as primary, with whatever data it loaded from disk. - The replica, which has the latest data, sees a primary with a different history and does a full resync. It throws away its data and copies the primary’s.
Step 4 is where data gets lost. Without AOF (Append Only File), the restarted primary loads its last RDB snapshot. Everything written since that snapshot is gone, including what the replica had. My probe confirmed it: out of 8,730,666 acknowledged writes, 3,450 were missing, all in slots of the shard I killed. One worker lost exactly one block, probe:{0:533}:533102 to 533999, slot 12303, owned by shard 5.
3,450 out of 8.7 million sounds like nothing. It is better to look at it as time: it was every write that shard took in the roughly 30 seconds since its last snapshot. With the default save rules, under enough writes, that window can be up to a minute. Valkey replication is asynchronous, and the docs say clearly that a cluster can lose acknowledged writes. The replication docs even have a section about this exact trap: a primary without full persistence that restarts automatically wipes its replicas.
Then I enabled AOF with appendfsync everysec through the Instance config and repeated the kill. Same sequence: the pod came back as primary in 2 seconds, and the replica did a full resync. But this time the primary loaded its AOF, and the final check found 1,984,672 acknowledged writes, 0 missing. With everysec, Valkey writes the AOF to the file before it replies to the client, and only the fsync is delayed. A killed process doesn’t lose what is already in the kernel page cache. A crashed node can still lose up to one second of writes. That is one kill, so it shows how it works, not a statistic.
Why 30 seconds?
The force-killed pod was back in 2 seconds, but its slots failed for 30. I suspected DNS and tested it: I force-deleted another primary and resolved its hostname twice a second from a client pod.
-0.4s 10.2.1.15      # old pod IP
+30.5s 10.2.1.23     # new pod IP, the pod was Ready at +6s
For 30 seconds after the kill, DNS kept returning the old pod IP. With TLS, the operator announces nodes by hostname (preferredEndpointType: Hostname), so clients connect by name. CoreDNS on LKE has ttl 30 and cache 30, which is also the default in most clusters. So clients spend 30 seconds trying to reach a pod that no longer exists. With a graceful delete this doesn’t matter: the replica takes over, and the slots move to a host that is already in DNS.
One more thing for client authors: memtier got stuck. After both force kills it went to 0 ops/sec and never recovered, even with --reconnect-on-error. I had to restart it. The redis-py probe recovered by itself in both cases. Before you trust your client to survive a failover, test it.
All runs in one place
Seconds in which the probe saw failed writes. Tap or click a row for details.
Scale out 3 → 6 shards0 s
126 seconds, throughput 39k → 75k ops/sec. The probe saw nothing. memtier got 5,060 CLUSTERDOWN errors from the first new shard over 10 seconds.
Scale in 6 → 3 shards0 s
313 seconds with lighter load. No errors at all.
Scale in 6 → 4 and replicas 1 → 20 s
776 seconds at full load. No errors, but throughput fell to ~33k ops/sec while shard 0 took most of the drained slots.
Scale out 4 → 6 at ~45% load3 s
118 seconds. One CLUSTERDOWN per second for 3 seconds when the first new shard got its slots, 3 failed writes in total. p99 went from 8 to 43 ms at worst.
Scale in 6 → 4 at ~45% load0 s
129 seconds, six times faster than at full load. No errors, p99 from 6 to 36 ms at worst.
Drain a node (2 primaries, 1 replica)0 s
114 seconds, one pod at a time thanks to the PodDisruptionBudget. Slowest write 1.25 seconds.
Delete primary pod, handoff OK (4 runs)1 s
The replica took over in ~0.7 seconds. 0 to 2 failed writes per run.
Delete primary pod, handoff missed (1 run)31 s
The replica never took over. The old primary came back after the restart and got its slots back. 465 failed writes. No data lost.
Force delete primary, AOF on32 s
No failover, 30 seconds of stale DNS. 692 failed writes, 0 acknowledged writes lost.
Force delete primary, AOF off31 s
Same as above, plus 3,450 acknowledged writes lost: the restarted primary came back from an older RDB snapshot and the replica resynced from it.
Rolling restart to enable AOF (12 pods)48 s
263 seconds in total. 371 failed writes in short bursts, one for each primary that restarted. memtier dipped to 30-50k ops/sec a few times.
In total the probe checked 10.7 million acknowledged writes*. Exactly 3,450 were lost, all from one force kill without AOF. Nothing else lost data, and no key ever had the wrong value.
What was breaking
Open the cards for the details.
Bug Scaling out again after a scale-in gets stuck
What happens: after 6 → 3, I scaled back to 6. The new shards never got any slots. The operator looped forever: "Re-introducing peers with changed addresses", "cannot identify primary for shard, skipping its roll", "skipping slot assignment; shard already exists in topology". Traffic was fine, but the cluster stayed at 3 shards' worth of slots.
Why: scale-in deletes the pods of the removed shards but keeps their PersistentVolumeClaims. The ValkeyCluster has persistence.reclaimPolicy: Retain by default. On the next scale-out, the new pods mount the old volumes, start with an old nodes.conf and claim to be nodes the cluster already forgot.
Workaround: set numShards back, delete the leftover PVCs (kubectl delete pvc valkey-<name>-<shard>-<node>-data for the removed shards), and scale out again. That worked right away. Deleting them also stops you from paying for volumes nobody uses.
Status: we will set reclaimPolicy: Delete in the provider, and report the stale nodes.conf handling to the operator.
Pending Scale-in puts drained slots on one shard
What happens: the drain moves most slots of the removed shards to a single remaining shard, then rebalances. The receiving shard peaked at 1.5 to 1.7 times its final number of keys, at full load and at 45% load alike. At full load it also became the bottleneck for throughput.
Why it matters: memory. A shard that is 60% full can't take 1.7 times its data. With noeviction writes fail, with any eviction policy keys disappear.
Status: we will propose spreading the drain across all remaining shards in the operator.
Investigating CLUSTERDOWN from the first new shard
What happens: when the first new shard gets its first slots, it answers some commands with -CLUSTERDOWN The cluster is down for about 10 seconds. 1,156 errors in the first scale-out, 5,060 in the second one with more load. At 45% load it was only 3, and those reached the probe.
Status: I don't know the cause yet. A client that retries CLUSTERDOWN doesn't notice it.
Investigating One graceful delete didn't fail over
1 run out of 5: the primary was deleted, the replica stayed a replica, and the slots were unavailable for 31 seconds until the old pod came back. The other 4 runs handed off in under a second. I want to reproduce it with logs before I guess.
Config A force-killed primary comes back without failover
What happens: the pod restarts faster than cluster-node-timeout (15 seconds), so there is no failover. The old primary comes back with its data from disk, and the replica throws its newer data away in a full resync.
Why it matters: without AOF, every write since the last RDB snapshot is lost, and the replica doesn't save you.
Status: enable AOF (see below). We are discussing turning it on by default in the provider.
Kubernetes 30 seconds of stale DNS after a pod restart
Nodes are announced by hostname, and CoreDNS caches the old pod IP for up to 30 seconds. Every force kill costs 30 seconds of failed writes on the affected shard, even though Valkey is back in 2.
On our list UI and status
The UI doesn't let you change the number of shards on an existing cluster yet, so I used kubectl patch. And during scaling, OpenEverest shows the instance as Provisioning, while it is serving traffic the whole time. Both are on our list.
Practical advice
If you run sharded Valkey on OpenEverest:
- Add shards when the primaries hit one core. Valkey runs commands on one thread, so more CPU per pod won’t help. In my test, twice the shards gave 1.9 times the throughput.
- But don’t wait until you’re at 100%. Scaling still works when the cluster is saturated, but scale-in took six times longer than at 45% load. Plan the change while you have headroom.
- Enable AOF. Add
appendonly: "yes"andappendfsync: everysecto the engine config. Without it, a crashed primary can take recent writes with it, replica or not. Enabling it restarts every pod once, so do it in a quiet hour. - Use a cluster-aware client that retries
MOVED,CLUSTERDOWNand connection errors. And test it with a failover before you rely on it. - Before you scale in, check memory. Until the drain is fixed, assume one shard can briefly get 1.7 times its share of data.
- Delete the PVCs of removed shards after a scale-in, until the provider does it for you.
- Use
kubectl drainfor node maintenance. It is the smoothest operation I tested.
What’s next
We will fix the PVC reclaim policy in the provider and report the re-grow loop and the drain imbalance to the valkey-operator project. I also want to dig into the CLUSTERDOWN burst and the missed graceful handoff, ideally with a reproducer.
The bigger lesson for me: the planned operations are in good shape. Doubling shards under full load in two minutes, with no lost data, is exactly what you want. Scale-in still needs work: it’s slow at full load, and it piles data onto one shard. The risky part is the unplanned one, and there the defaults matter more than the operator.
If you run these tests yourself and see something different, please open an issue in provider-valkey.
Try It Yourself
- Install: Follow the quick install guide to get OpenEverest v2 running in your cluster.
- Valkey: Learn more about Valkey on OpenEverest, or go straight to the provider-valkey repository.
- Chat: Join the conversation in the CNCF Slack (channel: #openeverest-users).

 Mike Teddy Omondi