
Milvus on OpenEverest - A Vector On Your Platform
 Sergey Pronin
Sooner or later someone asks the platform team for a vector database. It starts with one RAG prototype, then a second team wants semantic search, and soon there are three different setups nobody wants to own.
Milvus is one of the most popular open-source answers. It is also a lot of moving parts: five kinds of Milvus processes, plus etcd for metadata, object storage for data, and a write-ahead log. That is great for scaling and not so great for the person on call.
As of provider-milvus 0.2.0, Milvus is available on OpenEverest. You get the same Instance API and UI you use for PostgreSQL, MongoDB or Valkey, and the provider takes care of the rest. I wanted to see if it holds up for real platform work, so I did what a team would do with it:
- Created a production-shaped Milvus cluster.
- Indexed the entire English Kubernetes documentation for semantic and full-text search.
- Upgraded Milvus while a client kept searching, and tried to downgrade it.
- Took scheduled backups to S3 and cloned production into a staging instance from one of them.
Everything below ran on a real cluster. The numbers are what I measured, including the parts that didn’t go well.
How Milvus fits into OpenEverest
OpenEverest v2 is built around providers. The core knows nothing about Milvus. It stores an Instance, and the provider turns it into whatever the database needs. provider-milvus doesn’t reimplement Milvus lifecycle management either. It drives the Milvus Operator, which the Milvus maintainers ship, and bundles it in the same Helm chart.
The provider watches Instance resources with spec.providerRef.name: milvus and reconciles them into a Milvus custom resource. The operator does the rest: it starts the Milvus processes, installs etcd and MinIO as bundled dependencies, and rolls upgrades. The provider adds what OpenEverest users expect from any database: generated credentials, a connection Secret, a downgrade guard, and backups.
Backups are the one place where the provider runs something itself. The Milvus Operator has no backup feature, so the provider runs milvus-backup, the Milvus project’s own tool, as Kubernetes Jobs. It doesn’t copy any data on its own.
Pick a topology
Milvus comes in two shapes, and the provider supports both. Click through to see what each one runs.
All of Milvus in one process, plus etcd for metadata and MinIO for data. 3 pods and 2 volumes. My staging copy below ran this way. Good for development, staging and small datasets.
Every Milvus role is its own Deployment and scales on its own: proxies take client traffic, query nodes serve searches, data nodes flush and compact, streaming nodes own the write-ahead log, and mixCoord coordinates. The WAL defaults to Woodpecker, which keeps it in object storage, so you don't need Pulsar or Kafka. Pulsar is still an option. This is the shape I used for "production": 11 pods and 4 volumes.
You can also point either topology at your own etcd and S3 bucket, including IAM-based access such as EKS IRSA. I used the bundled ones here.
The setup
- Kubernetes 1.36 on Linode (LKE), 3 nodes with 8 vCPU and 16 GB each. The cluster also ran Valkey and PostgreSQL instances for other tests, so Milvus didn’t have it to itself.
- OpenEverest v2.0.0-dev.4
provider-milvus0.2.0, which bundles the Milvus Operator 1.3.9- Milvus 2.6.11 at first, upgraded to 2.6.15 later
- An S3 bucket on a separate MinIO in the cluster, used as the backup target
Install the provider
The provider chart bundles the Milvus Operator, so one helm install is enough:
helm install provider-milvus \
  oci://ghcr.io/openeverest/charts/provider-milvus \
  --version 0.2.0 \
  --namespace everest-system
kubectl get providers milvus
Create a Milvus cluster
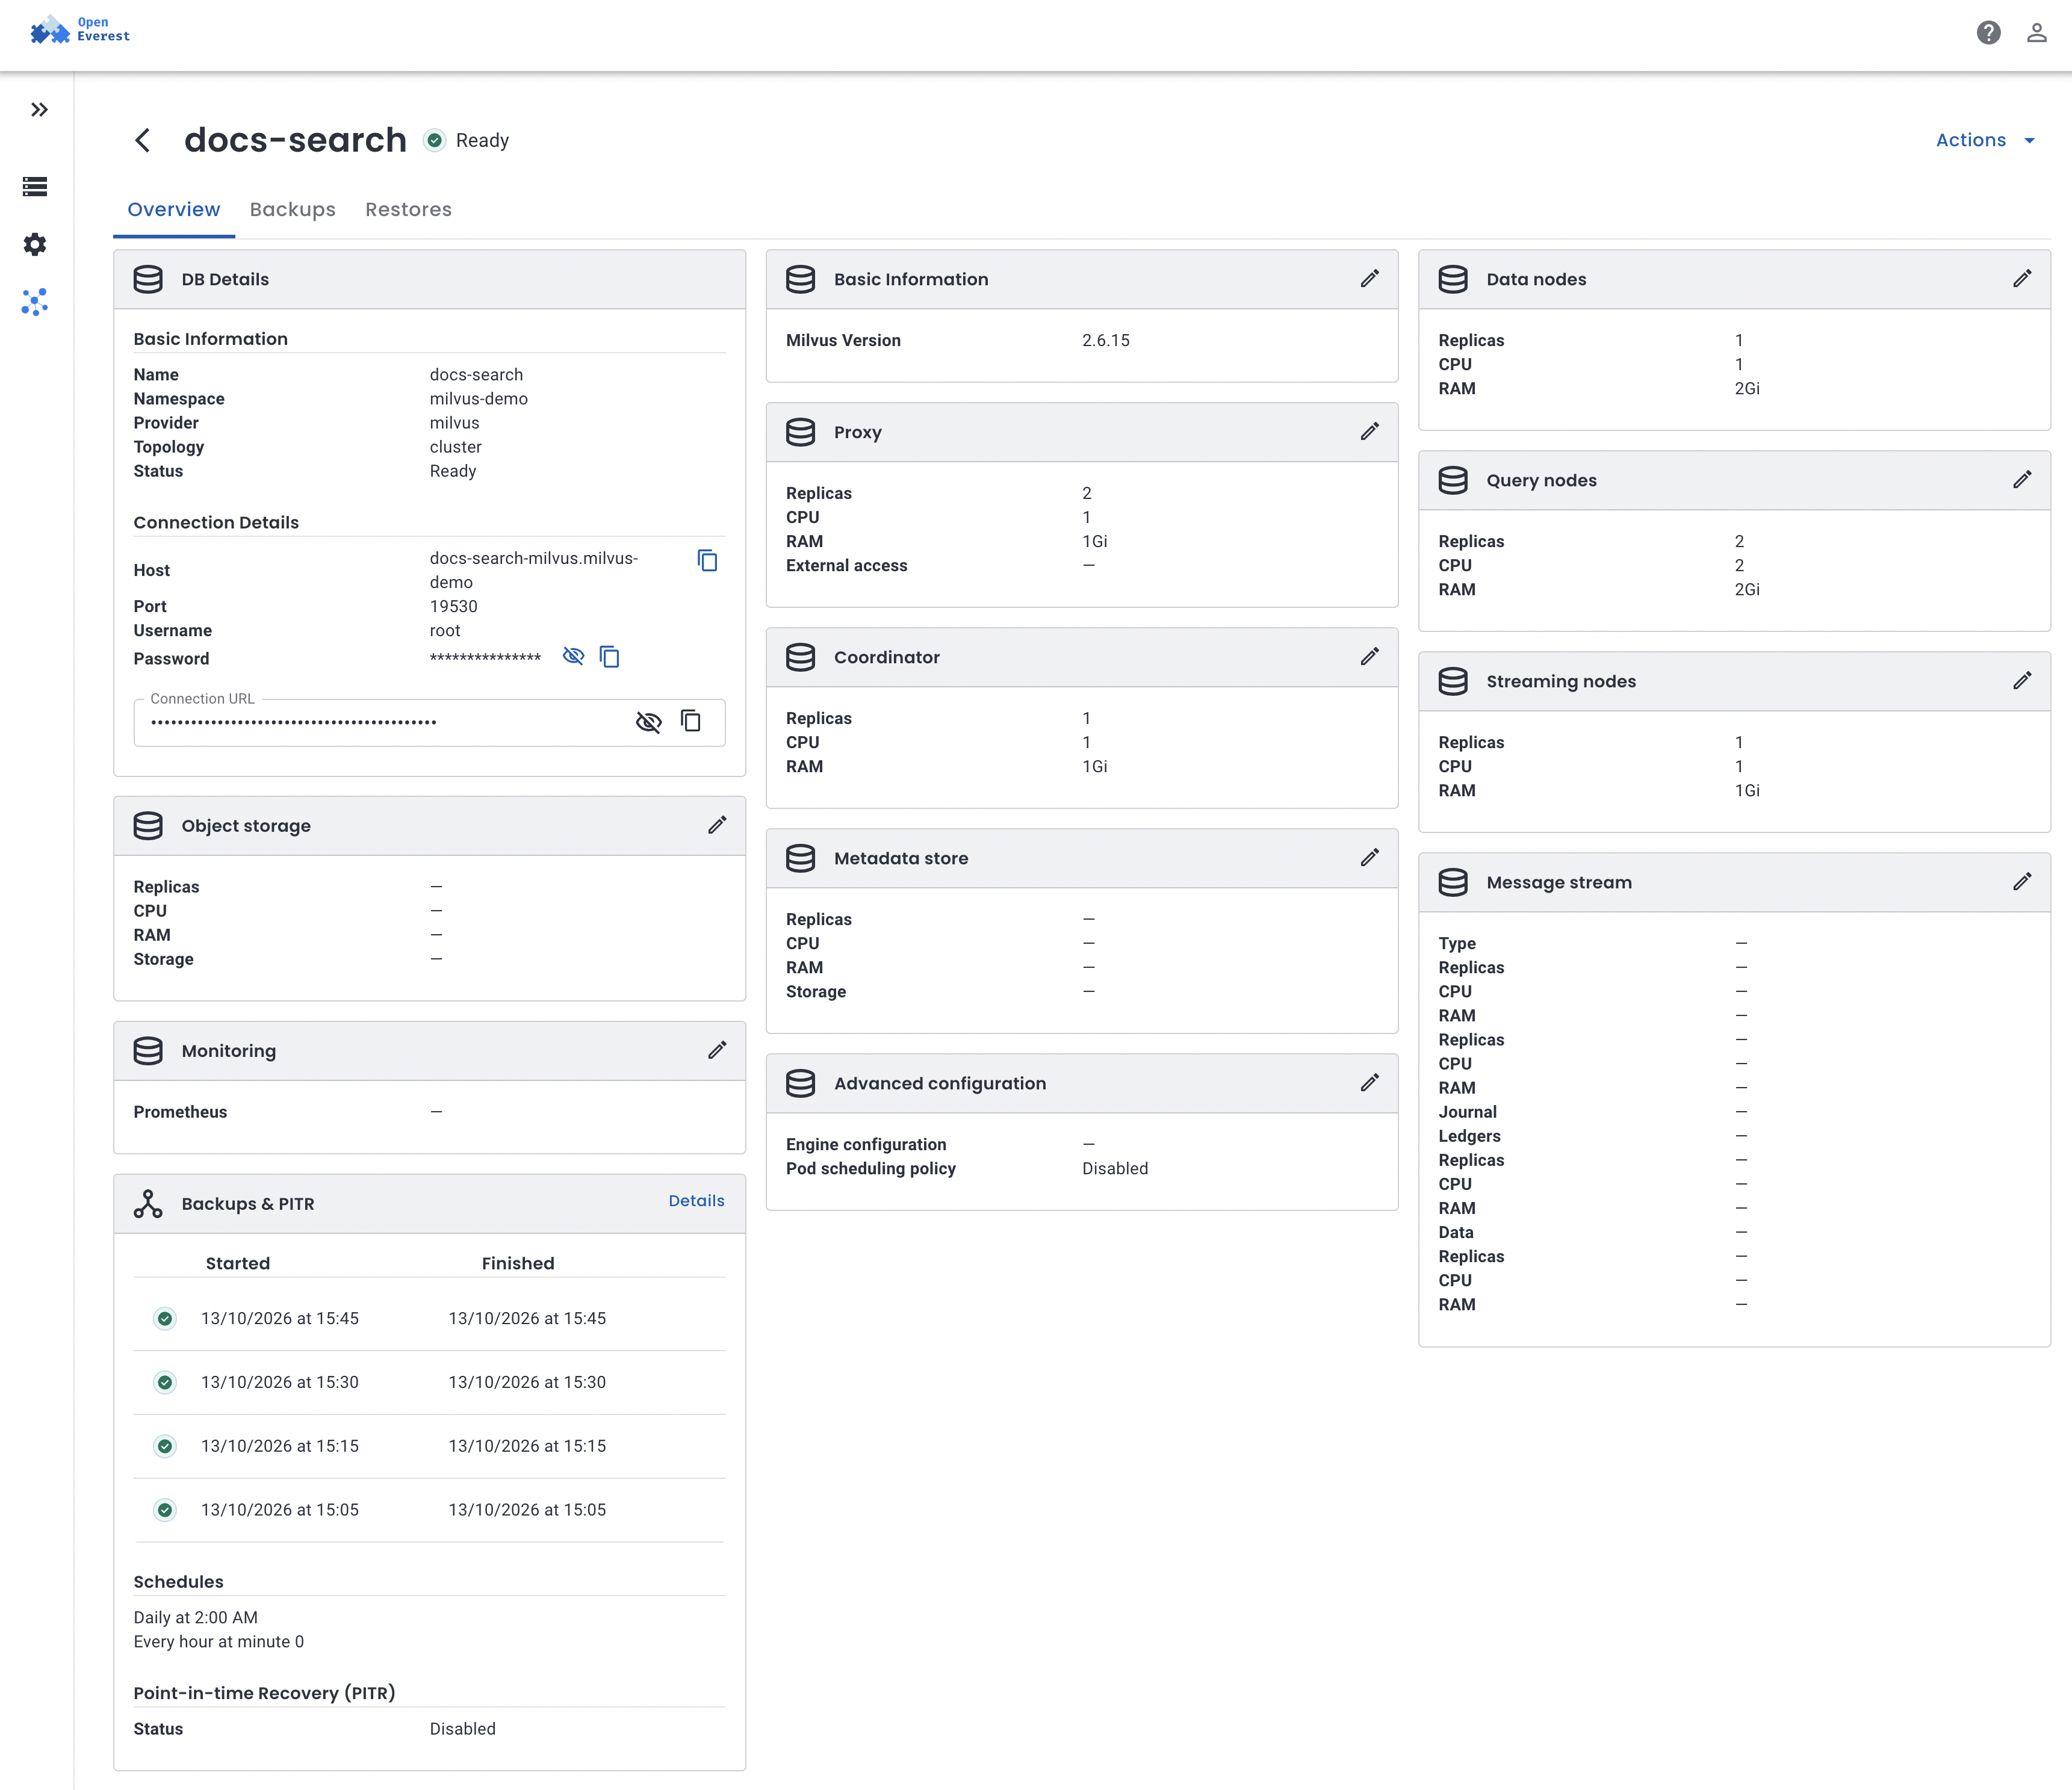
In the UI, Milvus shows up as one more engine. The form is generated from the provider’s own schema, so it only offers what the provider supports: topology and version first, then a section per Milvus role (replicas, CPU, RAM), then object storage, the metadata store and the message stream. Exposure, monitoring and pod scheduling sit under advanced configuration.
The UI creates an Instance. This is the one I used, with two proxies and two query nodes so a single pod restart doesn’t take searches down:
apiVersion: core.openeverest.io/v1alpha1
kind: Instance
metadata:
  name: docs-search
  namespace: milvus-demo
spec:
  providerRef:
    name: milvus
  version: "2.6.11"
  topology:
    type: cluster
  components:
    proxy:
      type: milvus
      replicas: 2
      resources:
        requests: {cpu: 250m, memory: 512Mi}
        limits: {cpu: "1", memory: 1Gi}
    mixCoord:
      type: milvus
      replicas: 1
    dataNode:
      type: milvus
      replicas: 1
    queryNode:
      type: milvus
      replicas: 2
      resources:
        requests: {cpu: 500m, memory: 1Gi}
        limits: {cpu: "2", memory: 2Gi}
    streamingNode:
      type: milvus
      replicas: 1
  backup:
    enabled: true
    classRef:
      name: milvus-backup
    storages:
      - storageRef:
          name: s3-backups
I trimmed the resources of the other roles; examples/instance-cluster.yaml in the provider repo has a complete cluster manifest.
It was Ready 2 minutes 42 seconds after kubectl apply, with 11 pods spread across the 3 nodes. Most of that time was etcd and MinIO starting and getting their volumes. Here is what one Instance turned into:
| Resource | What docs-search got |
|---|---|
| Milvus pods | 7: 2 proxies, 2 query nodes, 1 each of mixCoord, dataNode, streamingNode |
| Dependencies | 3 etcd pods, 1 MinIO pod, 4 volumes of 10 GiB |
| Requests / limits | 2.65 CPU and 6 GiB requested, 9 CPU and 10 GiB limits |
| Service | docs-search-milvus, gRPC on 19530 |
| Secrets | docs-search-conn (connection details), docs-search-credentials (root password), docs-search-minio (generated MinIO keys) |
Authentication is on from the start, with a random root password. Applications read everything from the connection Secret: host, port, username, password, a ready-made uri, and a token in the root:<password> form pymilvus expects. The password never appears in the Milvus custom resource or in the config Milvus renders. To change it, you edit the credentials Secret and the provider rotates it in Milvus.
Put something real in it: semantic search over the Kubernetes docs
A vector database without vectors proves little. Platform engineers have a corpus everybody knows: the Kubernetes documentation. So I indexed all of it.
- Data: every page under
content/en/docsof kubernetes/website at commit703e31c: 1,721 pages, split by##/###headings into 15,582 chunks, 14 MiB of text. - Embeddings:
BAAI/bge-small-en-v1.5(384 dimensions) through fastembed, on CPU, in a Kubernetes Job. No GPU anywhere. - Search: an HNSW index on the embeddings, plus Milvus 2.6’s built-in BM25 full-text search on the same text. Milvus computes the BM25 sparse vectors itself, so the client only sends the text.
This is the collection schema:
schema = client.create_schema(auto_id=True)
schema.add_field("id", DataType.INT64, is_primary=True)
schema.add_field("title", DataType.VARCHAR, max_length=512)
schema.add_field("url", DataType.VARCHAR, max_length=512)
schema.add_field("text", DataType.VARCHAR, max_length=8192, enable_analyzer=True)
schema.add_field("dense", DataType.FLOAT_VECTOR, dim=384)
schema.add_field("sparse", DataType.SPARSE_FLOAT_VECTOR)
schema.add_function(Function(name="bm25", function_type=FunctionType.BM25,
                             input_field_names=["text"], output_field_names=["sparse"]))

index = client.prepare_index_params()
index.add_index(field_name="dense", index_type="HNSW", metric_type="COSINE",
                params={"M": 16, "efConstruction": 200})
index.add_index(field_name="sparse", index_type="SPARSE_INVERTED_INDEX", metric_type="BM25")
The client connects with the values from docs-search-conn, mounted as environment variables. Loading took 30 minutes, and Milvus was the fast part:
| Step | Time |
|---|---|
| Embedding 15,582 chunks on 4 CPU cores | 29 min 22 s |
| Inserting them into Milvus, 64 rows per batch | 35 s |
| Flush and load into the query nodes | 1.7 s |
Then I asked it questions. Each one ran three ways: dense (vectors only), BM25 (keywords only) and hybrid (both, merged with reciprocal rank fusion in one hybrid_search call). Top 3 hits:
"Limit how many pods of a deployment can be down during a voluntary disruption"
- denseDisruptions / Pod disruption budgets · Disruptions / Dealing with disruptions · Deployments / Updating a Deployment
- bm25Specifying a Disruption Budget / Think about how your application reacts · Disruptions / Pod disruption budgets · Disruptions / Voluntary and involuntary disruptions
- hybridDisruptions / Pod disruption budgets · Specifying a Disruption Budget / Think about how your application reacts · Disruptions / Dealing with disruptions
The question never says "PodDisruptionBudget", and every mode still finds it. This is the case semantic search is for.
"How do I drain a node before maintenance without breaking my app?"
- denseUpgrading kubeadm clusters / Drain the node · Upgrading Linux nodes / Drain the node · Upgrading Windows nodes / Drain the node
- bm25Running ZooKeeper / Surviving maintenance · kubectl Quick Reference / Interacting with Nodes · Node lifecycle conditions
- hybridUpgrading kubeadm clusters / Drain the node · Running ZooKeeper / Surviving maintenance · kubectl Quick Reference / Interacting with Nodes
The honest miss. The page you want, "Safely Drain a Node", isn't in anyone's top 3. The dense model latches onto "drain the node" sections in upgrade guides, and BM25 onto the word "maintenance". Search for "PodDisruptionBudget" and dense search puts that page second. This is about chunking and the model, not the database, but it's the work your application teams will do on top of what you give them.
"Why is my pod stuck in CrashLoopBackOff?"
- densePod Lifecycle / How Pods handle problems with containers · Specifying a Disruption Budget / Unhealthy Pod Eviction Policy · Pod Lifecycle / Pod phase
- bm25Debug Pods / Debugging Pods · Jobs / Job tracking with finalizers · Windows debugging tips / Node-level troubleshooting
- hybridPod Lifecycle / How Pods handle problems with containers · Debug Pods / Debugging Pods · Jobs / Job tracking with finalizers
Dense gets the explanation, BM25 gets the debugging guide. Hybrid puts both in the top 2, which is why it's worth having both indexes in one collection.
"Run a pod only on nodes with a GPU"
- denseSchedule GPUs / Using device plugins · Schedule GPUs / Manage clusters with different types of GPUs · Running Pods on Only Some Nodes
- bm25Schedule GPUs / Using device plugins · Schedule GPUs / Automatic node labelling · Schedule GPUs / Automatic node labelling
- hybridSchedule GPUs / Using device plugins · Schedule GPUs / Manage clusters with different types of GPUs · Schedule GPUs / Automatic node labelling
Day 2, with traffic on
Creating a database is the easy part. I wanted to see what happens to the applications when the platform team does its job: upgrade, back up, clone.
So before touching anything, I started a probe: a Job with 4 threads running hybrid searches back to back, recording every result and its latency. On the untouched cluster it did about 900 searches per second, p50 4 ms, p99 10 ms. It ran for 20 minutes, through everything below.
Upgrading Milvus 2.6.11 → 2.6.15
In the UI you change the version on the instance. With kubectl it’s one field:
kubectl -n milvus-demo patch instance docs-search --type merge \
  -p '{"spec":{"version":"2.6.15"}}'
The provider sees that every component uses the same image and switches the operator to a rolling upgrade. The operator then upgrades one role at a time, in the order Milvus requires. Click through the timeline:
Probe: ~900 searches/s, 0 errors
The version changes on the Instance, and the instance goes to Updating. The coordinator goes first: a new mixCoord pod starts on 2.6.15, takes over, and the old one goes away.
Probe: ~880 searches/s, 0 errors
The streaming node, which owns the write-ahead log, is next. There is only one, so for a few seconds there were two, then one again.
Probe: ~830 searches/s for 2 minutes, 0 errors
Query nodes are upgraded blue/green: the operator starts a second query node group on 2.6.15, moves the loaded segments over, then scales the old group to zero. This is the only part the probe noticed. Throughput dipped by about 8% while the new group loaded the collection, and the slowest second still had 768 searches.
Probe: ~950 searches/s, 0 errors
The data node is upgraded. Searches don't touch it, so nothing to see.
Probe: ~940 searches/s, 0 errors
Proxies go last, one at a time. The client was connected through the Service the whole time and didn't see a single failed call.
Probe: ~930 searches/s, 0 errors
The last pod was running 2.6.15 about 6 minutes after the change. The Instance only said Ready at 8 minutes 38 seconds, when the operator reported the upgrade finished. Until then it stayed Updating and the connection details stayed published.
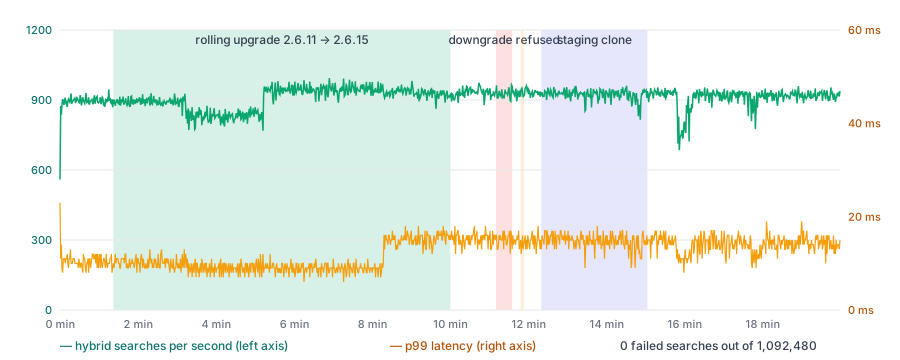
Zero failed searches out of 468,420 during the upgrade, and 1,092,480 over the whole 20 minutes. The slowest single search took 46 ms.
One thing I can’t explain yet: about a minute after the proxies finished, p99 went from ~10 ms to ~15 ms and stayed there, while p50 stayed at 4 ms and throughput went up a bit. It could be a change in 2.6.15 or how segments landed on the new query nodes. I didn’t dig into it for this post. The two dips around 16 and 18 minutes are mine: two short Jobs loading the embedding model on a shared node.
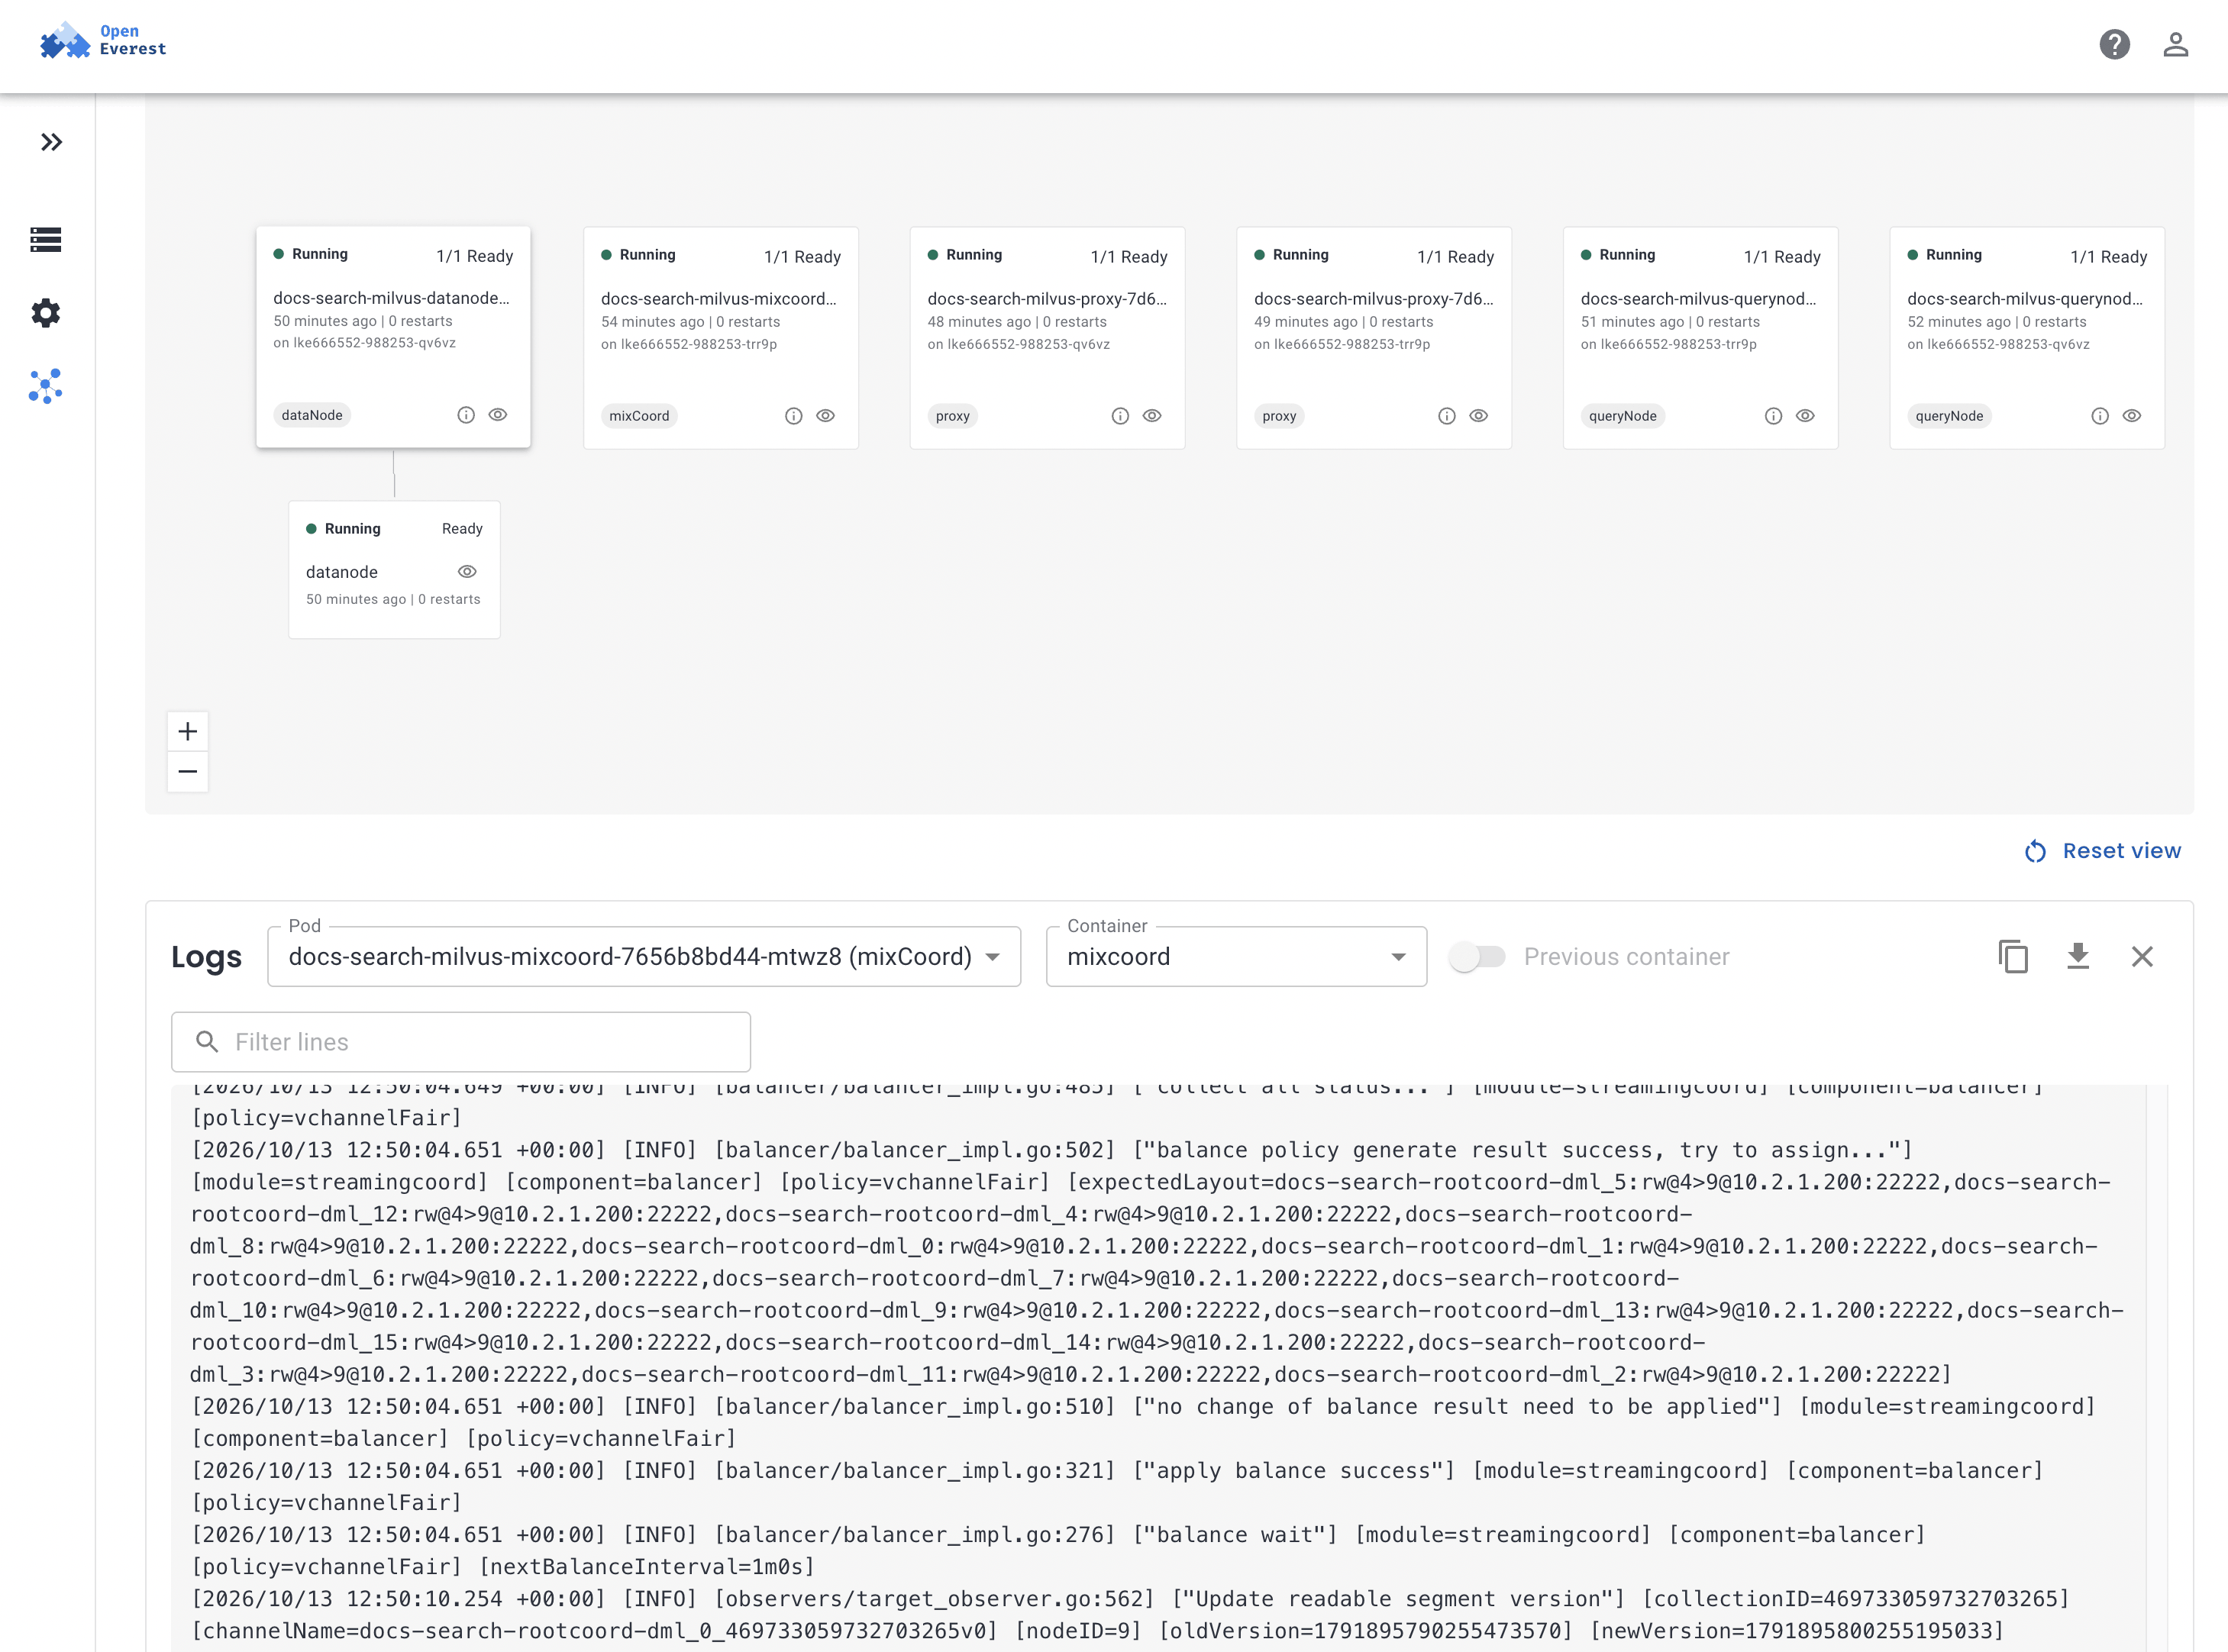
To see what happened inside, you don’t need kubectl. The Inspector plugin shows every pod behind the instance, which node it runs on and how often it restarted, and streams its logs. Here, after the upgrade: the Milvus pods spread across the nodes with 0 restarts, and the coordinator’s log assigning the WAL channels to the streaming node.
Trying to go back
Downgrades are where vector databases bite you: the newer version may already have written metadata the older one doesn’t understand. So the provider refuses them:
kubectl -n milvus-demo patch instance docs-search --type merge \
  -p '{"spec":{"version":"2.6.11"}}'
Milvus didn’t change: every pod stayed on 2.6.15, and the probe didn’t notice. The provider log says exactly why:
component "dataNode" cannot be downgraded from 2.6.15 to 2.6.11; choose 2.6.15 or newer
The rough part is where you see it. The Instance went to Failed, but on OpenEverest v2.0.0-dev.4 the reason isn’t copied to the Instance status. “Failed” with no message is scary when Milvus itself is fine. Setting the version back to 2.6.15 brought the Instance back to Ready within seconds.
Backups to S3
OpenEverest describes backup targets with a BackupStorage. The provider reads it and hands its bucket and credentials to milvus-backup. Credentials are passed as Secret references, not written into any config:
apiVersion: backup.openeverest.io/v1alpha1
kind: BackupStorage
metadata:
  name: s3-backups
  namespace: milvus-demo
spec:
  type: s3
  s3:
    bucket: milvus-backups
    region: us-east-1
    endpointURL: http://backup-minio.backup-storage.svc:9000
    credentialsSecretRef:
      name: s3-backups
---
apiVersion: backup.openeverest.io/v1alpha1
kind: Backup
metadata:
  name: docs-search-before-reembed
  namespace: milvus-demo
spec:
  origin:
    type: Instance
    instanceRef:
      name: docs-search
  classRef:
    name: milvus-backup
  storageRef:
    name: s3-backups
The backup was Succeeded in 5 seconds and wrote 24 MB under everest/milvus/milvus-demo/docs-search/ in the bucket. The probe didn’t notice it.
Schedules live on the instance. Each one becomes a CronJob, and every run shows up as a regular Backup that you can restore from or delete:
spec:
  backup:
    storages:
      - storageRef:
          name: s3-backups
        schedules:
          - name: nightly
            enabled: true
            cron: "0 2 * * *"          # UTC
            retention: {type: count, count: 7}
          - name: every-15m
            enabled: true
            cron: "*/15 * * * *"
            retention: {type: time, duration: 1d}
The first every-15m run started at 12:15:00 and was done at 12:15:05. Retention deletes the old runs, and their data in the bucket with them.
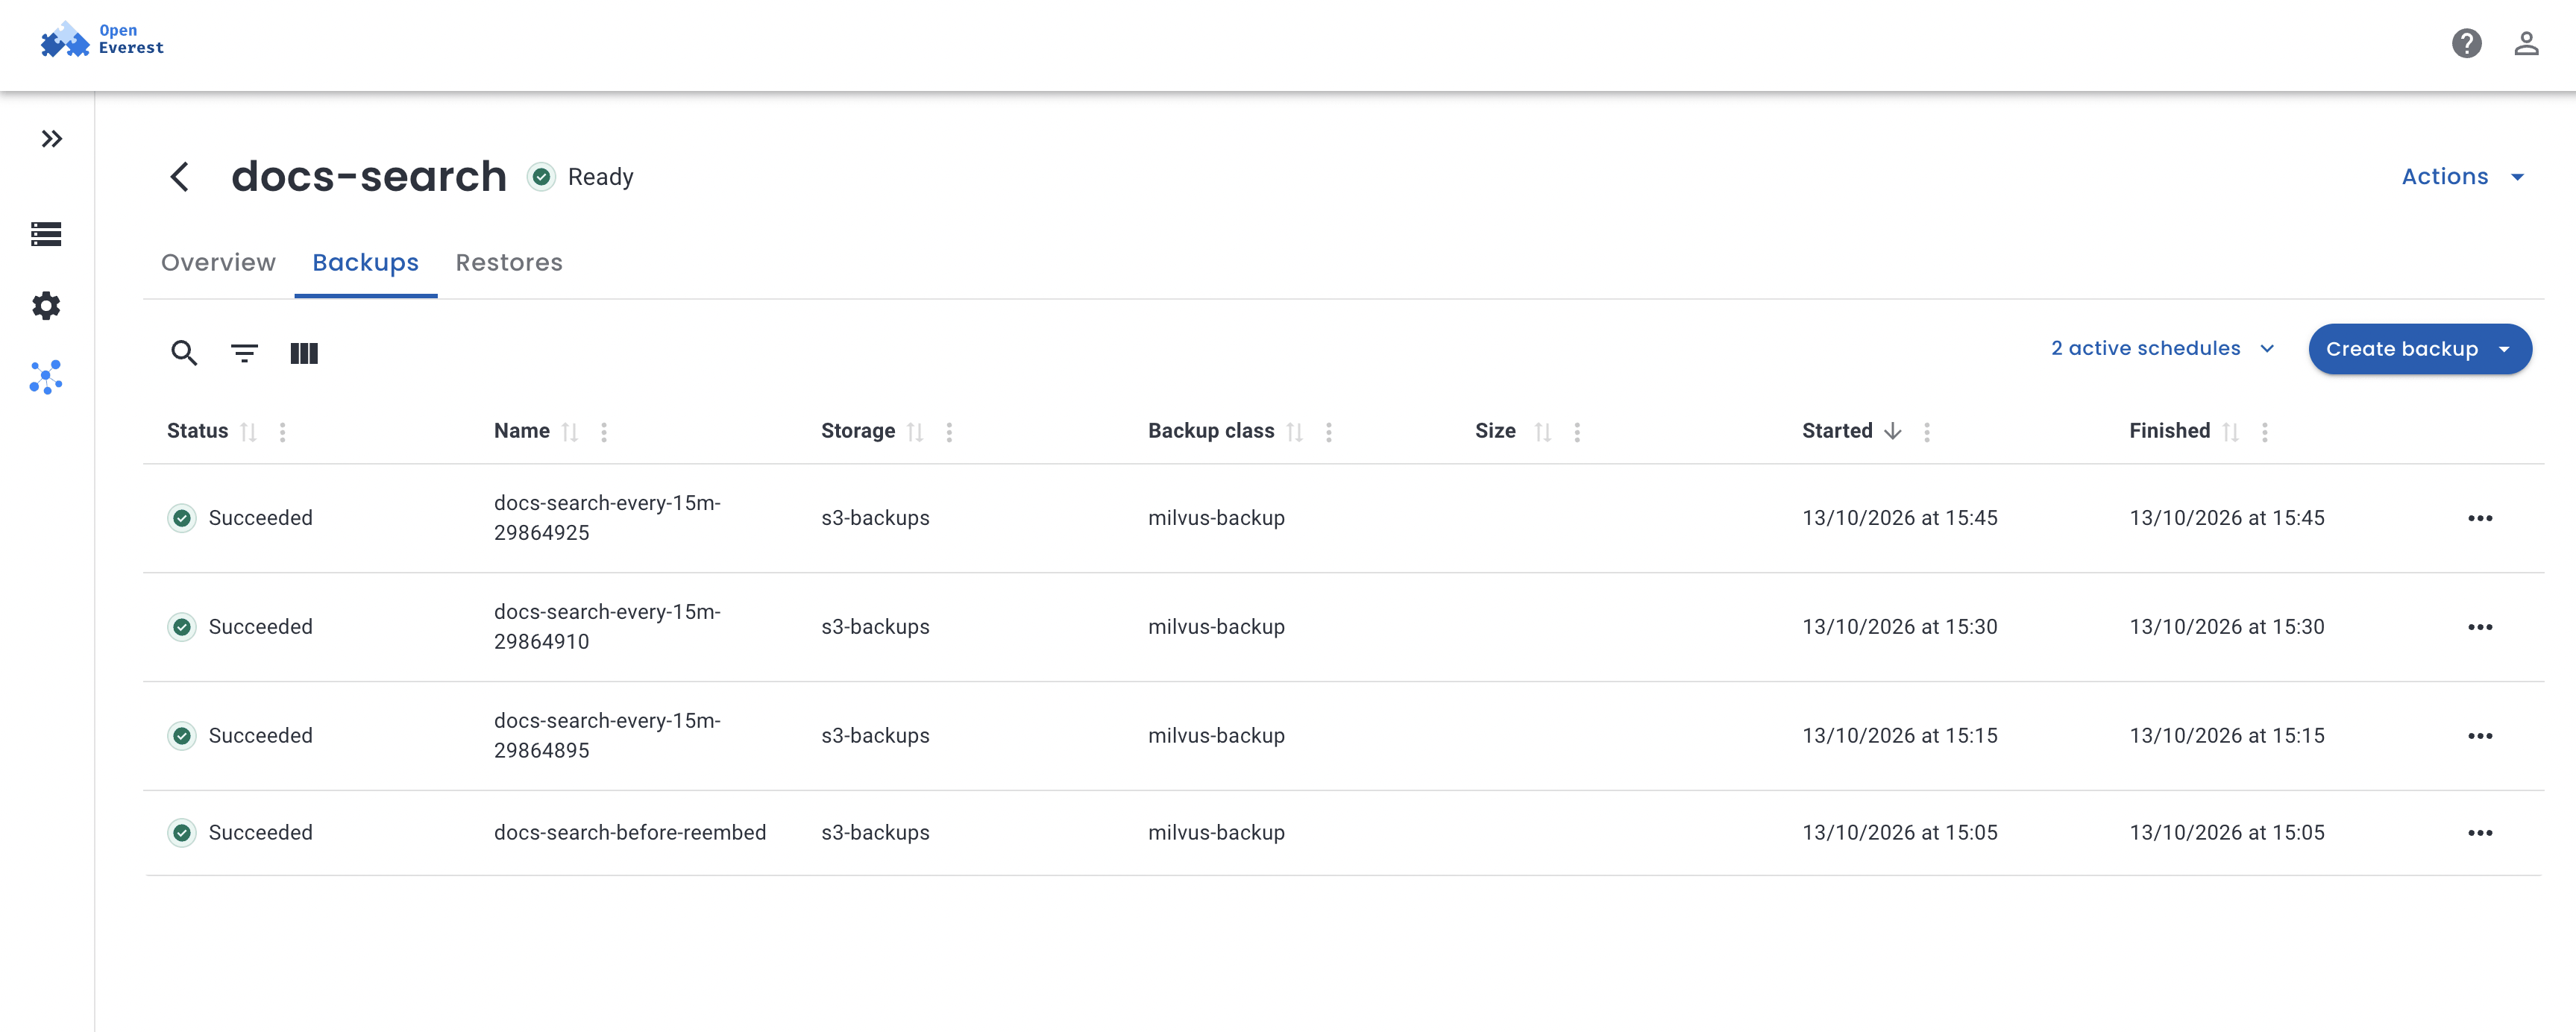
The UI shows times in my local timezone (UTC+3), so 12:05 UTC is 15:05 here. The Size column is still empty; the provider doesn’t report backup sizes yet.
Cloning production into staging
This is the feature I’d show a team first. Staging that has the same data as production, created by the platform and not by a script someone wrote two years ago. A new Instance with a dataSource starts empty, restores the backup, and only then reports Ready. It doesn’t have to match production’s topology: staging here is a single standalone pod.
apiVersion: core.openeverest.io/v1alpha1
kind: Instance
metadata:
  name: docs-search-staging
  namespace: milvus-demo
spec:
  providerRef:
    name: milvus
  topology:
    type: standalone
  components:
    standalone:
      type: milvus
      replicas: 1
  backup:
    enabled: true
    classRef:
      name: milvus-backup
    storages:
      - storageRef:
          name: s3-backups
  dataSource:
    type: Backup
    backup:
      backupRef:
        name: docs-search-before-reembed
| Time | Staging |
|---|---|
| 12:06:16 | Instance created, phase Restoring |
| 12:08:23 | Milvus is up, the restore Job starts |
| 12:08:54 | Restore done: 15,582 rows, HNSW and BM25 indexes rebuilt |
| 12:08:59 | Ready, connection Secret published |
2 minutes 43 seconds from nothing to a searchable copy. The restore itself took 31 seconds; the rest was Milvus starting. While seeding, the instance reports Restoring and doesn’t publish its connection details, so nothing connects to a half-restored database.
Is it really the same? I ran the six questions against both instances and compared the top 5 results by primary key. They matched exactly, and so did the row count.
What’s not there yet
Core Errors don't reach the Instance status
On OpenEverest v2.0.0-dev.4, when the provider rejects a change, like the downgrade above, the Instance says Failed with an empty message. The reason is only in the provider log. Core is adding a Ready condition with the reason ValidationFailed (openeverest#3351); the part that fills it in is still in progress.
Limit Restores need Milvus 2.6.12 or newer
Older 2.6 releases corrupt data restored through bulk import (milvus-io/milvus#48114), so the provider refuses restores into them. Backups work on every version. 2.6.15 is the default in 0.2.0.
Limit No point-in-time recovery, no global snapshot
milvus-backup takes full backups, collection by collection. Writes during a backup aren't paused, so each collection is consistent with itself but not with the others. For most vector workloads that's fine. If your collections must line up exactly, pause writes around the backup.
Limit S3-compatible backup storage only
AWS S3, MinIO, and other S3-compatible stores. GCS through its S3 interoperability should work, but I haven't tested it. Native GCS and Azure Blob need new BackupStorage types in OpenEverest core.
Planned No UI for the data
OpenEverest manages the database, not its collections. There's no way to browse collections or run a query from the OpenEverest UI. Bundling Attu, Milvus's web UI, is on the list (#52).
Planned Bundled dependencies are for getting started
The bundled MinIO runs as a single pod by default, and pod scheduling rules apply to Milvus pods only, not to etcd or MinIO. For production data, point the instance at your own S3 bucket. The provider supports that, including IAM-based access, and external etcd.
In 0.2.0, but not in this post
- GPU builds. A
2.6.15-gpuversion bundle runs every role on the GPU image. - Node pools per role. Run one role, for example query nodes, as several groups with their own node selectors, such as one group on L40S nodes and one on H200.
- Prometheus. One toggle creates a
PodMonitorfor every Milvus component. - External access.
LoadBalancerorNodePorton the client-facing component, with the external address in the connection Secret. - Password rotation. Change the password in the credentials Secret and the provider applies it in Milvus.
Practical advice
If you’re about to offer Milvus to your teams:
- Start teams on standalone, move to cluster when they need it. Standalone is 3 pods; the cluster above is 11.
- Run at least two proxies and two query nodes in production. That’s the shape that kept the probe at zero errors through the upgrade. mixCoord and the streaming node ran one replica each here and were replaced without errors, but I didn’t kill them by force.
- Plan for the embedding pipeline, not the database. Loading 15,582 chunks took 35 seconds in Milvus and 29 minutes in a CPU embedding model. Your teams’ bottleneck is GPUs for embeddings, not vector storage.
- Turn on scheduled backups from day one, to real object storage, not the bundled MinIO.
- Give teams staging copies from backups instead of letting them load production data by hand. It took under 3 minutes here.
Try It Yourself
- Install: Follow the quick install guide to get OpenEverest v2 running in your cluster.
- Milvus: Go to the provider-milvus repository for the README, examples and the backup design.
- Chat: Join the conversation in the CNCF Slack (channel: #openeverest-users).
If you try this and see something different, please open an issue in provider-milvus.

 Mike Teddy Omondi