High Availability PostgreSQL: From Zero to Cluster
 Shivansh Sinha
PostgreSQL is the workhorse of the web, but running it highly available is where most setups quietly fall short. I wanted to see whether OpenEverest could actually deliver a production-grade HA Postgres cluster, and then prove it by breaking it on purpose.
Everything below was run on a local kind cluster with OpenEverest v2 and
provider-percona-postgresql, which manages Postgres by driving Percona’s own
Kubernetes operator underneath — so the HA logic you’re seeing here (leader election,
timeline promotion, replica rejoin) is the same battle-tested Patroni-based mechanism
Percona ships in production, not something OpenEverest reimplemented itself. OpenEverest’s
job is orchestration: turning a single Instance spec into a correctly-configured,
correctly-sized cluster.
Environment: kind v0.30.0 (4 nodes: 1 control-plane + 3 workers, kindest/node:v1.34.0),
kubectl v1.32.2, Helm v3.19.0, OpenEverest v2.0.0-dev.2, provider-percona-postgresql
v0.1.0.
1. Deploy
Installing the OpenEverest v2 core is a single Helm install:
helm repo add openeverest https://openeverest.github.io/helm-charts/
helm repo update
helm install everest-core openeverest/openeverest \
    --devel --version "2.0.0-dev.2" \
    --namespace everest-system --create-namespace
Three pods this time (dev.2 adds a plugin hub alongside the controller and server):
NAME                                       READY   STATUS    RESTARTS   AGE
everest-controller-77c7b89cd8-rqlts        1/1     Running   0          4m31s
everest-core-plugin-hub-6b5dbb49c4-bcgdc   1/1     Running   0          4m31s
everest-server-748d76868f-fqkpm            1/1     Running   0          4m31s
The provider installs the same way, as a tagged OCI artifact:
helm install provider-percona-postgresql \
    oci://ghcr.io/openeverest/charts/provider-percona-postgresql \
    --version 0.1.0 -n everest-system
Provider comes up clean on the first try:
$ kubectl get providers.core.openeverest.io -n everest-system
NAME                          AGE
provider-percona-postgresql   8m11s
This is the whole definition for a 3-node HA Postgres cluster:
apiVersion: core.openeverest.io/v1alpha1
kind: Instance
metadata:
  name: pg-ha-demo
spec:
  providerRef:
    name: provider-percona-postgresql
  topology:
    type: cluster
  components:
    engine:
      type: postgresql
      replicas: 3
      resources:
        requests: { cpu: "250m", memory: 512Mi }
      storage:
        size: 5Gi
    proxy:
      type: pgbouncer
      replicas: 2
kubectl apply -f pg-ha-demo.yaml -n everest-system
The same thing is a few clicks in the Everest UI, if you’d rather not hand-write YAML — pick the provider, name the database, and the same fields (topology, node count, proxy) are just form inputs:

That defaults to a 2-node topology; bumping it to 3 nodes to match the CLI example above is a live edit from the instance’s own page after creation, not something you have to get right up front — the Resources panel supports scaling the running cluster, not just setting it at creation time. Either path lands in the same place, visible in the instance list:

The provider translates this into a PerconaPGCluster and the operator brings up five
pods — three Postgres engines, two PgBouncer proxies:
NAME                                    READY   STATUS    RESTARTS   AGE
pg-ha-demo-instance1-64vj-0             2/2     Running   0          9m30s
pg-ha-demo-instance1-6fm6-0             2/2     Running   0          9m30s
pg-ha-demo-instance1-ppqh-0             2/2     Running   0          9m30s
pg-ha-demo-pgbouncer-569ddb6844-8ghd9   2/2     Running   0          9m30s
pg-ha-demo-pgbouncer-569ddb6844-jnfdl   2/2     Running   0          9m30s

$ kubectl get instances -n everest-system
NAME         PROVIDER                      VERSION   PHASE   AGE
pg-ha-demo   provider-percona-postgresql   18.4-1    Ready   9m32s
Credentials are minted automatically by the operator and land in a Kubernetes Secret — no manual wiring, and a ready-to-use connection URI comes included:
$ kubectl get secret pg-ha-demo-conn -n everest-system -o jsonpath='{.data}' | ...
host     : pg-ha-demo-pgbouncer.everest-system.svc
port     : 5432
dbname   : pg-ha-demo
username : pg-ha-demo
password : <generated>
uri      : postgresql://pg-ha-demo:<generated>@pg-ha-demo-pgbouncer.everest-system.svc:5432/pg-ha-demo?sslmode=require
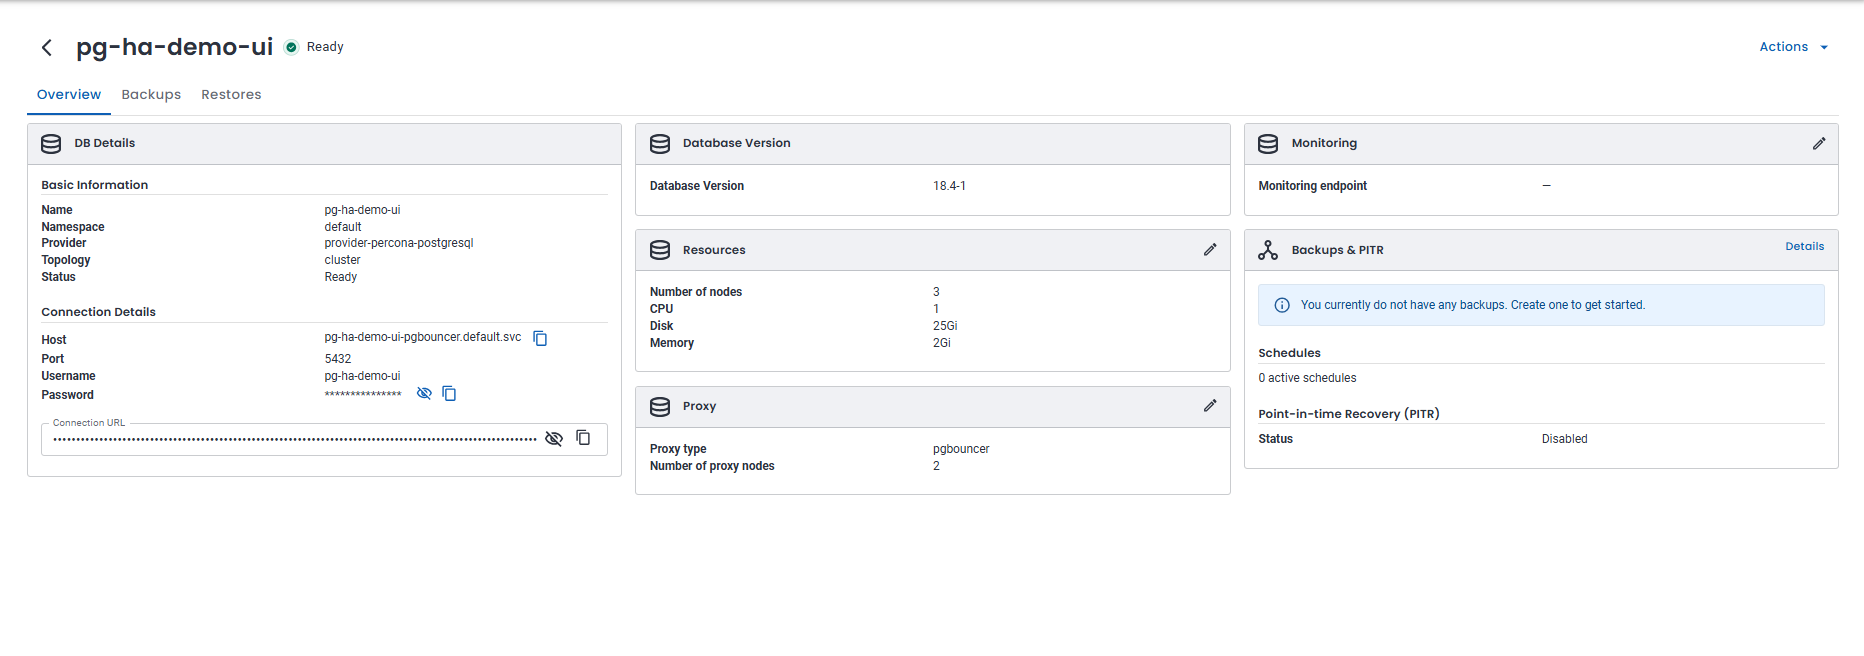
The same details, plus the full topology at a glance, are on the instance’s page in the UI:
2. Configure
The only setting I actually tuned for this demo was replica count and storage size —
engine.replicas: 3 and storage.size: 5Gi are the two knobs that matter for an HA
layout. The provider’s cluster topology defaults to exactly this shape: one primary,
two replicas, fronted by a two-node PgBouncer proxy tier — a connection-pooling layer
clients connect to instead of the Postgres pods directly, so pod churn during a failover
doesn’t require any client-side reconnect logic. For a heavier workload you’d raise the
resource requests; for this demo, minimal was plenty.
3. Verify HA
“Pods are Running” isn’t proof of HA — so here’s the actual replication state, queried directly through Patroni, which the operator runs as the coordination layer:
$ kubectl get pods -l postgres-operator.crunchydata.com/cluster=pg-ha-demo \
    -L postgres-operator.crunchydata.com/role
NAME                           ROLE
pg-ha-demo-instance1-ppqh-0    primary
pg-ha-demo-instance1-64vj-0    replica
pg-ha-demo-instance1-6fm6-0    replica
(Those labels really do say crunchydata.com, not a Percona one — that’s not a typo in
this post. Percona’s PostgreSQL Operator v3.0.0, which the provider bundles, is itself
built on top of CrunchyData’s PGO, and hasn’t renamed the CRD group or pod labels away
from it. Worth knowing if you go looking for “percona” in your own cluster’s labels and
come up empty.)
$ kubectl exec pg-ha-demo-instance1-ppqh-0 -c database -- \
    psql -U postgres -d postgres -c \
    "select application_name, state, sync_state, replay_lag from pg_stat_replication;"

      application_name       |   state   | sync_state | replay_lag
-----------------------------+-----------+------------+------------
 pg-ha-demo-instance1-6fm6-0 | streaming | async      |
 pg-ha-demo-instance1-64vj-0 | streaming | async      |
And Patroni’s own cluster view, zero lag across the board:
$ kubectl exec ...ppqh-0 -- patronictl list
+ Cluster: pg-ha-demo-ha (7675637947551236217) -----------------------------+---------+-----------+----+-------------+-----+------------+-----+
|            Member           |                     Host                    |   Role  |   State   | TL | Receive LSN | Lag | Replay LSN | Lag |
+-----------------------------+---------------------------------------------+---------+-----------+----+-------------+-----+------------+-----+
| pg-ha-demo-instance1-64vj-0 | pg-ha-demo-instance1-64vj-0.pg-ha-demo-pods | Replica | streaming |  1 |   0/9000000 |   0 |  0/9000000 |   0 |
| pg-ha-demo-instance1-6fm6-0 | pg-ha-demo-instance1-6fm6-0.pg-ha-demo-pods | Replica | streaming |  1 |   0/9000000 |   0 |  0/9000000 |   0 |
| pg-ha-demo-instance1-ppqh-0 | pg-ha-demo-instance1-ppqh-0.pg-ha-demo-pods | Leader  | running   |  1 |             |     |            |     |
+-----------------------------+---------------------------------------------+---------+-----------+----+-------------+-----+------------+-----+
To be extra sure, I wrote a row on the primary and read it back on both replicas immediately — no delay, no manual sync:
$ kubectl exec ...ppqh-0 -- psql -c "INSERT INTO ha_demo_test (note) VALUES ('written on primary');"
INSERT 0 1
$ kubectl exec ...64vj-0 -- psql -c "SELECT * FROM ha_demo_test;"
 id |              note
----+---------------------------------
  1 | written on primary
$ kubectl exec ...6fm6-0 -- psql -c "SELECT * FROM ha_demo_test;"
 id |              note
----+---------------------------------
  1 | written on primary
4. Chaos test — killing the primary
This is the real test of “is HA actually here.” I ran it twice, because the first run taught me my kill wasn’t testing what I thought it was.
Attempt 1: just the pod
kubectl delete pod pg-ha-demo-instance1-ppqh-0 -n everest-system --grace-period=0 --force
Patroni’s own promotion history (the authoritative record — more on why I switched to this instead of eyeballing a poll loop below) shows a real timeline advance 7 seconds after the kill:
$ kubectl exec ...-0 -- patronictl history
| TL |    LSN    |            Reason            |            Timestamp             |          New Leader         |
|  1 | 184549536 | no recovery target specified | 2026-08-19T07:42:29.006465+00:00 | pg-ha-demo-instance1-ppqh-0 |
Look closely at that “New Leader” column: it’s the exact same pod name that was just killed. That’s not a fluke or a stale label — the pod’s own start time matches the kill instant to the second, and its restart count is 0, meaning Kubernetes tore down the old pod object and created a brand new one under the same StatefulSet identity. The reason it won leadership back is simple once you see it: force-deleting a pod doesn’t touch its PVC, and the replacement pod reattached to the exact same volume — which already held the primary’s fully-current data. Patroni running in that fresh pod raced the two real replicas for the leader lock using data that was, from Postgres’s perspective, still the most advanced copy around, and won.
So this test proved something real (the cluster survives its primary process dying, in about 7 seconds, no manual steps) — just not the thing I set out to prove. It’s closer to “can a StatefulSet member restart cleanly” than “does a healthy replica take over when the primary is truly gone.” For that, the primary’s storage has to actually go away too.
Attempt 2: the pod, its PVC, and its node
kubectl cordon <node-hosting-the-primary>          # so the replacement can't land back on the same volume
kubectl delete pod pg-ha-demo-instance1-64vj-0 -n everest-system --grace-period=0 --force
kubectl delete pvc pg-ha-demo-instance1-64vj-pgdata -n everest-system --grace-period=0 --force
(Local-path volumes in kind are pinned to the node that provisioned them, so cordoning is what actually prevents the reuse that happened in attempt 1 — a plain pod delete wasn’t enough.)
$ kubectl exec ...-0 -- patronictl history
| TL |    LSN    |            Reason            |            Timestamp             |          New Leader         |
|  3 | 251658400 | no recovery target specified | 2026-08-19T08:02:52.300455+00:00 | pg-ha-demo-instance1-6fm6-0 |
Kill was issued at 08:02:50.924. Genuine promotion of a different, pre-existing
replica in ~1.4 seconds — faster than attempt 1, not slower. That’s worth correcting an
assumption I’d have made without testing it: it’s tempting to guess that losing a whole
node would be slower than losing just a pod, since more machinery (kubelet’s
node-not-ready detection, pod eviction) has to notice something’s wrong. But Patroni
doesn’t wait on any of that — it watches its own lock in the DCS independent of what
Kubernetes thinks, so the surviving replicas promoted just as fast once there was no
ambiguity about the old primary coming back on the same data. (Caveat on the caveat: a
cordon-and-delete isn’t a perfect stand-in for a real hardware/node failure either — a
genuine crash leaves Kubernetes’ own node-lease timeout running in the background before
it even attempts a reschedule, which I didn’t exercise here since I forced the deletion
by hand.)
$ kubectl exec ...6fm6-0 -- patronictl list
+ Cluster: pg-ha-demo-ha ---------------------------+---------+-----------+----+-------------+-----+------------+-----+
|            Member           |     Role  |   State   | TL | Receive LSN | Lag | Replay LSN | Lag |
| pg-ha-demo-instance1-64vj-0 | Replica | streaming |  4 |  0/11002C88 |   0 | 0/11002C88 |   0 |
| pg-ha-demo-instance1-6fm6-0 | Leader  | running   |  4 |             |     |            |     |
| pg-ha-demo-instance1-ppqh-0 | Replica | streaming |  4 |  0/11002C88 |   0 | 0/11002C88 |   0 |
The connection endpoint updated automatically, same as before — the app-facing service is indirected through Patroni’s own leader-lock, so no secret or DNS change was needed to land on the new primary.
Zero data loss, across three real promotions now. The row written before any of this
started (id 1) survived attempt 1, attempt 2, and a full PVC wipe of two different
members, intact on every node:
$ kubectl exec ...6fm6-0 -- psql -c "INSERT INTO ha_demo_test (note) VALUES ('written on new leader after cross-node failover');"
$ kubectl exec ...6fm6-0 -- psql -c "SELECT * FROM ha_demo_test ORDER BY id;"
 id |                      note
----+-------------------------------------------------
  1 | written on primary
 34 | written on new leader after cross-node failover
Worth stating plainly rather than glossing over, still: replication here is async
(sync_state: async, visible back in the verification step), and both real promotions
only ever had one or two rows in flight. Async replication can lose the most recently
committed transaction if the primary dies before shipping it; three clean runs in a row
is good evidence, not a guarantee. If you need a stronger one, that’s a
synchronous_commit / synchronous-replica question for the provider to answer, not
something a kill test like this can prove either way.
The old primary’s replacement re-synced from a completely empty volume, on a different node, in under a minute. No stale data to reconcile with this time — the operator had to bootstrap it as a fresh replica from scratch, and it still caught up to zero lag in under 47 seconds:
$ kubectl get pods -n everest-system -l postgres-operator.crunchydata.com/cluster=pg-ha-demo -o wide
pg-ha-demo-instance1-64vj-0   2/2   Running   0   47s   ...   openeverest-dev2-worker2
Takeaway
The core HA behavior held up under an actual kill — twice, once properly: automatic
leader election, a real timeline promotion rather than a label swap (confirmed against
Patroni’s own promotion history, not just eyeballed timing), a connection endpoint that
followed the new primary with no manual DNS or secret change, and no lost data across
three separate promotions. That’s Percona’s own production-grade PostgreSQL Operator and
Patroni doing what they already do in production — OpenEverest’s job here is correctly
turning a small declarative Instance spec into that cluster, not reimplementing any of
the HA logic itself.
Also worth being upfront about: OpenEverest isn’t tied to Percona specifically. It’s
built to be provider-agnostic, and CloudNativePG is already available as a
community-contributed provider alongside Percona’s. Both (and other extensions) are
listed in the OpenEverest Hub — the community
catalog of installable providers and plugins, itself currently in developer preview.
provider-percona-postgresql is just the one this post happened to test.
If you want to try this yourself, the provider repo has setup instructions at openeverest/provider-percona-postgresql.

 Mike Teddy Omondi
 Sergey Pronin
